Research Article
Austin J Nutri Food Sci. 2014;2(4): 1023.
Effect of Pretreatments on Physical and Thermal Properties of Bael (Aegle marmelos Correa) Fruit Pulp During Storage
Anurag Singh1*, H.K. Sharma2, Navneet Kumar3 and Ashutosh Upadhyay4
1Department of Food Technology, FET, RBS Engineering Technical Campus, Agra, Uttar Pradesh, India
2Department of Food Engineering and Technology, Sant Longowal Institute of Engineering and Technology (SLIET), Longowal, Sangrur, Punjab, India
3Department of Agricultural Process Engineering, College of Agricultural Engineering and Technology, Anand Agricultural University, Godhra, Gujarat, India
4Department of Food Science and Technology, National Institute of Food Technology Entrepreneurship and Management, Deemed to be University, Kundli, Sonipat, Haryana, India
*Corresponding author: :Anurag Singh, Department of Food Technology, FET, RBS Engineering Technical Campus, Agra, Uttar Pradesh, India
Received: February 20, 2014; Accepted: March 24, 2014; Published: April 02, 2014
Abstract
The study was performed to evaluate the effect of pretreatment on various physical and thermal properties of Bael pulp. The fruit pulp of Bael fruit was extracted and TSS of the extracted pulp was raised to 25°Brix by adding 65°Brix sugar syrup. The pH of pulp was set at 3.0 and 3.5, which was heated at 80– 85°C for 15, 20 and 25 minutes and kept at refrigerated conditions for 80 days. The product was analyzed for TSS, pH, titratable acidity, colour values, thermal properties and yeast and mold counts during storage. The TSS, pH, titratable acidity, colour–L*, a*, b*, thermal conductivity and specific heat ranged between 18–25°Brix, 2.6–3.5, 0.15–0.35%, 20.32–56.87, 2.95–20.28, 23.58–64.01, 0.37– 0.76 w⁄m°C, 1.73–2.50 J⁄g°C respectively. The microbial load in terms of yeast and mold counts was also under the prescribed limits for 60 days under the refrigerated conditions. Minimum colour change and maximum sensory score was observed at 3 pH and 15 min heating under refrigerated storage. The zero or first order models were well fitted for the responses of the bael pulp (3 pH, 15 min) stored under refrigerated conditions.
Keywords: Bael; pulp; storage; pretreatments; physical and thermal properties.
Introduction
The bael fruit (Aegle marmelos Correa), occupies an important place among the indigenous fruits of India. The bael fruit is mentioned in Vedas, Ramayana and also in Buddhist & Jain literature. Its nutritional and medicinal properties make the tree one of the most valuable, cheap and good source of nutrients, vitamins and qualities to cure dirrhorea, dysentery and other stomach ailments. The marmelosin (C13H12O3) content is found in the bael fruit which is known as panacea of stomach ailments. The unripe fruits are astringent, digestive, stomachic and are generally prescribed for treating diarrhea and dysentery.
The ripe fruit of bael is sweet aromatic, nutritious and very palatable being highly esteemed and eaten by all classes of people. The fruit has excellent aroma which is not destroyed even during processing, thus there is untapped potentiality for processing bael into various products. These products being highly nutritive and therapeutically important can be very easily popularized in internal as well as international markets [1]. Enzymatic extraction of Bael has been reported been reported by Singh et al. [2]. Moisture desorption isotherm of bael pulp and adsorption isotherm of pulp powder were determined at 20, 30, 40 and 50°C [3]. The characterization of bael fruit hydrolysate treated with commercial pectinase enzyme was investigated by Charoensiddhi and Anprung [4]. The antioxidant potential of bael fruit pulp extracts showed good antioxidant power [5].
Bael is usually processed into products like preserves, refreshing beverages, powder, leather, squash, nectars, toffee, jam, syrup. For all preparations, pulp is the prerequisite therefore is required to be stored to supply throughout the year. During storage, fruit pulps undergo various changes in their quality parameters. Fruits pulps, when used as raw material for industries, are exposed to various treatments like adjustment of pH, heating and cooling processes. Therefore, thermal properties of foods play an important role in heat transfer processes and are required to be studied during storage. These properties allow to predict the speed of the penetration of heat inside the food [6]. Physical and thermal properties of bael pulp during storage are required to be explored to predict the shelf life. Therefore, the objective of this work was to examine the physico–chemical and thermal properties changes of bael fruit pulp as a function of storage time and pretreatment conditions.
Materials and Methods
Materials
Fully ripe fresh bael fruits of Kagazi variety, without any visual defects, were procured from Agricultural farm of R.B.S. College, Bichpuri, Agra (India). The bael fruits were broken by hammering and the crude mass was scooped out with the help of stainless steel spoon. The scooped crude mass was homogenized by blending manually. This crude mass was used for extraction of commercial quality pulp. The fruit pulp was extracted as per the method given by Roy [7]. The extracted pulp had total soluble solids 18° Brix and pH 4.3.
Processing of pulp and experimental design
The TSS of the extracted pulp was raised to 25°Brix by adding 65°Brix sugar syrup [7]. The pulp samples were adjusted at two pH levels (3.0 and 3.5) and heated for three durations (15, 20 and 25 minutes) at 80–85°C and stored under refrigeration conditions. The pH was adjusted with citric acid solution. Each replicate consisted of 200 g of pulp and was analyzed for TSS, pH, titratable acidity, colour values, thermal properties and yeast and mold counts during storage.
Control samples were also adjusted for pH (3.0 and 3.5) to observe the effect of heating on the measured responses.
Measurement of responses
Total soluble solids
Total soluble solid (°Bx) was determined with a hand refractometer (ERMA, Tokyo, Japan, Range 0–32%). The refractometer was calibrated with distilled water. The pulp tissues, 10g were homogenized using a kitchen blender with 40 mL of distilled water. The mixture was filtered through cotton wool. A drop of the filtrate was then placed on the prism glass of the refractometer to obtain the degree Brix. The readings were multiplied by dilution factor to obtain the original percent total soluble solid content of the bael pulp.
pH
The pH determination was carried out by using the remainder of the filtrate from total soluble solid determination using digital pH meter (Labtronics, India; Model: LT–10) after calibrating with the buffers of pH 4, and 7.
Titratable acidity
Titratable acidity was analyzed using standard method [8]. Fruit pulp, 10 g was homogenized with 40 mL of distilled water using kitchen blender, the mixture was filtered through cotton wool. Five mL of the filtrate with one to two drops of phenolphthalein (1%) as indicator was titrated using 0.1 N NaOH to an endpoint. The results were expressed as percentage of citric acid per 100 g fresh weight.
Colour measurement
The colour of pulp was measured by Hunter colour measuring system (Hunter Associates Laboratory Inc., Reston, VA; Model: Miniscan XE plus). The colour was measured in terms of L*, a* and b* values, where L* is the lightness (0 = black, 100 = white), a* for the red–purple (positive values) to the bluish–green (negative values) and b* indicates the yellowness (positive values) and blueness (negative values).
Measurement of Thermal Properties
Thermal properties such as thermal conductivity, and specific heat were determined using a thermal properties analyzer (Decagon Devices Incorporation, USA, Model: KD2). It was operating based on the line heat source method and the values were obtained directly from the digital read–out.
Microbial load
Microbial load in terms of yeasts and molds were enumerated on acidified potato dextrose agar, which was acidified to pH 3.5 ± 0.1 by addition of sterile 10% tartaric acid. Plates were inverted and incubated at 25°C±1 for 3 – 7 days [9]. Colonies were counted after proper incubation using colony counter (Analab Systems, New Delhi, Model: LM–10) then results were reported as colony forming units (cfu) per gram.
Sensory characteristics
Sensory analysis was conducted for all the samples. Twelve panelists were asked to assess the bael pulp and mark on a Hedonic Rating Test (1 - Dislike extremely, 5 – Neither like nor dislike and 9 – Like extremely) in accordance with their opinion for taste, texture, color and overall acceptability.
Kinetics of change in responses during storage
The loss in food quality during storage may be described with zero and first order equations [10]. The experimental data obtained from the storage study was fitted to these equation. The degradation kinetics of colour and ascorbic acid with storage was also established by Kumar et al. and Rai et al. [11,12] respectively.
Changes in total soluble solids, pH, acidity, colour (L*, a* and b*), thermal conductivity and specific heats as a result of storage was investingated using the following zero and first order kinetics as shown in equation 1 and 2 respectively.
C = C ± k t …(1)
lnC = lnC ± k t …(2)
Where C is the measured value of response, C0 is the initial value of the corresponding response, t is the storage time and K0, K1 are the reaction rate constants for zero and first order respectively. Whereas (+) and (−) signs represent the increase and decrease in the corresponding quality response of food respectively.
The goodness of fit of the selected mathematical models to the experimental data was evaluated with the correlation coefficient (R2), the reduced chi–square (χ2) and the root mean square error (RMSE). R2 is a measure of the amount of variation around the mean explained by the model. Reduced chi–square (χ2) is the mean square of the deviations between experimental and predicted values for the models and was used to determine the goodness of fit. The RMSE gives the deviation between the predicted and experimental data and it is required to reach zero value [13]. The goodness of fit will be better, if R2 values are higher and χ2 and RMSE values are lower [14].
The reduced chi–square (χ2) and the root mean square error (RMSE) were calculated using following expressions:
Where MRExp,i is the ith experimental moisture ratio, MRPre,i is the ith predicted moisture ratio, N is the number of observations and z is the number of constants. In this study, the regression analysis was performed using MS Office – 2007, Redmond, Washington.
Results and discussion
The samples were analyzed for total soluble solids (TSS), pH, acidity, colour, microbial loads, thermal conductivity and specific heat to study the storage stability of the product processed at various pH and heating temperatures. The total soluble solids, pH, acidity, colour-L*, a*, b*, microbial loads, thermal conductivity and specific heats for fresh sample at 3pH were 25°Brix, 3, 0.15%, 56.87, 13.71, 64.01, nil, 0.372 W⁄m°C, 1.73 kJ⁄kg.°C, and at 3.5 pH were 25°Brix, 3.5, 0.15%, 47.61, 14.50, 44.65, nil, 0.37 W⁄m°C., 1.75 kJ⁄kg.°C respectively.
Total soluble solids, pH and titratable acidity
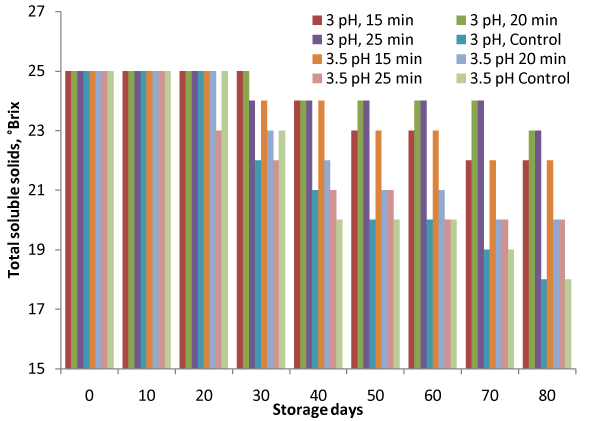
Total soluble solid indicates concentration of sugar and the soluble constituents in the pulp, which may be changed or degraded with storage time due to interaction of pulp constituents with storage period. The TSS should be maintained during the storage to restrict water activity, which may affect the growth of micro–organism. The total soluble solids reduced from 25 to 22°Brix for heat processed samples against 18°Brix for control samples (Figure.1). Minimum reduction of 25°Brix to 23°Brix was observed for samples kept at 3 pH with 15min and 20 min heating under refrigerated conditions. F–values for variation due to treatments and storage were 13.35 and 24.22 against FCritical values of 2.18 and 2.11 respectively (Table 1), indicate that the variation is significant (p<0.05). It can also be observed that no reduction was observed till 20 days storage in almost all the processing conditions. The change is TSS may be due conversion of sugar and other components to acid and different metabolites by the action of yeast and moulds during the storage. Similar decrease in TSS for steeped aonla fruits was also observed by [15].
Figure 1: Variation in Total Soluble Solids (TSS) during storage.
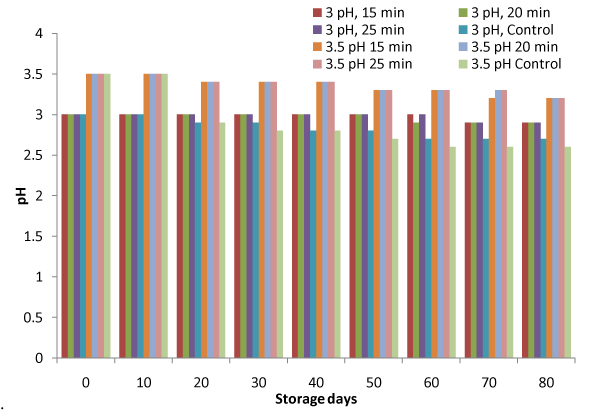
Figure 2: Variation in pH during storage.
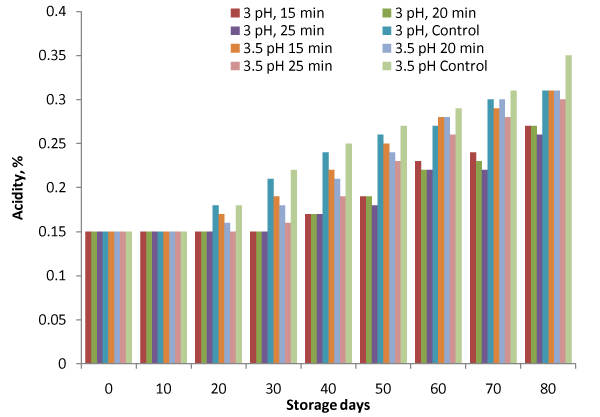
Figure 3: Variation in titratable acidity during storage.
    Source of    Variation
    SS
    df
    MS
    F
    P-value
    Fcritical


    TSS
    pH &    Heating time
    84.65
    7
    12.09
    13.35
    5.46E-10
    2.18


    Storage    days
    175.50
    8
    21.94
    24.22
    1.42E-15
    2.11


    Error
    50.72
    56
    0.91


    Total
    310.88
    71


    pH
    pH &    Heating time
    3.33
    7
    0.48
    36.29
    1.39E-18
    2.18


    Storage    days
    0.75
    8
    0.09
    7.12
    1.87E-06
    2.11


    Error
    0.73
    56
    0.01


    Total
    4.82
    71


    Acidity
    pH &    Heating time
    0.03
    7
    0.00
    17.91
    3.06E-12
    2.18


    Storage    days
    0.20
    8
    0.02
    102.18
    1.46E-30
    2.11


    Error
    0.01
    56
    0.00


    Total
    0.24
    71


    Colour-L*
    pH &    Heating time
    357.08
    7
    51.01
    4.18
    9.08E-04
    2.18


    Storage    days
    1397.66
    8
    174.71
    14.33
    4.06E-11
    2.11


    Error
    682.79
    56
    12.19


    Total
    2437.53
    71


    Colour-a*
    pH &    Heating time
    162.16
    7
    23.17
    13.68
    3.63E-10
    2.18


    Storage    days
    565.55
    8
    70.69
    41.75
    7.21E-21
    2.11


    Error
    94.82
    56
    1.69


    Total
    822.54
    71


    Colour-b*
    pH &    Heating time
    277.50
    7
    39.64
    3.15
    7.05E-03
    2.18


    Storage    days
    1945.17
    8
    243.15
    19.32
    1.45E-13
    2.11


    Error
    704.77
    56
    12.59


    Total
    2927.44
    71


    Thermal    conductivity
    pH &    Heating time
    0.00
    7
    0.00
    1.84
    9.77E-02
    2.18


    Storage    days
    1.14
    8
    0.14
    597.19
    2.68E-51
    2.11


    Error
    0.01
    56
    0.00


    Total
    1.16
    71


    Specific    heat
    pH &    Heating time
    0.08
    7
    0.01
    5.65
    5.76E-05
    2.18


    Storage    days
    2.76
    8
    0.34
    177.54
    6.55E-37
    2.11


    Error
    0.11
    56
    0.00


    Total
    2.94
    71


    Total    Microbial Load
    pH &    Heating time
    618.65
    7
    88.38
    2.85
    1.30E-02
    2.18


    Storage    days
    328437.72
    8
    41054.71
    1321.81
    7.11E-61
    2.11


    Error
    1739.33
    56
    31.06


    Total
    330795.69
    71


    Overall    acceptability
    pH &    Heating time
    4.81
    7
    0.69
    6.73
    8.61E-06
    2.18


    Storage    days
    66.00
    8
    8.25
    80.78
    6.25E-28
    2.11


    Error
    5.72
    56
    0.10


    Total
    76.52
    71
Table 1: ANOVA for variation during storage.
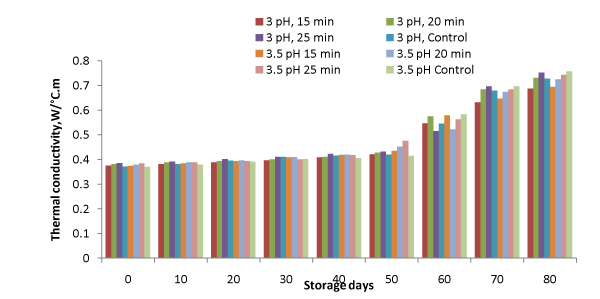
Figure 4: Variation in thermal conductivity during storage.
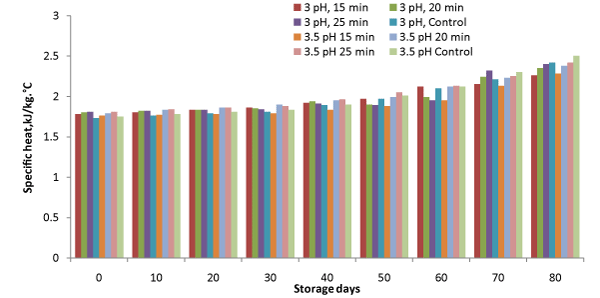
Figure 5: Variation in specific heat during storage.
It was observed from Figure. 2 that pH decreased from 3.0 to 2.9 and 3.5 to 3.2 for heated samples against 2.7 and 2.6 for control samples, which may be due to fermentation of sugar and decrease in pH. during storage for samples stored at pH of 3.0 and 3.5 respectively. However, the variation of pH was not observed till 50 and 10 days for samples at 3 and 3.5pH respectively in heat treated samples. F–values for variation due to treatments and storage days were 36.29 and 7.12 against FCritical values of 2.18 and 2.11 respectively (Table 1), indicate that variation is significant (p<0.05). It was further observed that sample with treatment of 3 pH and 15 min heating time attained minimum change in pH during storage. The change in pH may be due to the breakdown of pectin in to pectenic acid. Similar decrease in pH for apple pulp also has been reported by Kinh et al. and Muhammad et al. [16,17].
Titratable acidity of sample increased from 0.15 to 0.27%, and 0.15 to 0.31% against 0.31 and 0.35% for control samples at 3 and 3.5 pH respectively during the storage of 80 days (Figure. 3). However, the variation in acidity was not observed till 30 and 10 days storage period at 3 and 3.5pH respectively. The increase in titratable acidity due to breakdown of pectin substance for apple pulp has been reported by Muhammad et al. [17]. F–values (Table 1), showed significant variation (p<0.05).
Colour
L* values of samples decreased with the storage period. This exhibits that the samples turned darker in colour during storage. It can be observed from Table 2 that L*–values of all the samples decreased along with control samples under refrigerated storage. The minimum change was observed in the samples with 3pH and 20 min heating time (32.10 to 26.54) followed by 15 min heating at same pH (31.87 to 26.13). Control sample at 3pH observed maximum change in L* values (P<0.05).
    Colour    value
    pH
    Heating    time, min
    0 (Fresh)
    10
    20
    30
    40
    50
    60
    70
    80


    L*
    3
    15
    31.87
    29.85
    28.89
    28.04
    29.12
    27.88
    27.53
    27.32
    26.13


    3
    20
    32.10
    31.59
    29.04
    29.01
    28.63
    28.15
    27.13
    27.15
    26.54


    3
    25
    33.64
    31.51
    27.94
    25.84
    25.10
    23.46
    22.11
    21.00
    20.32


    3
    Control
    56.87
    37.35
    32.41
    20.60
    27.81
    25.52
    24.13
    23.14
    22.82


    3.5
    15
    32.62
    32.75
    26.27
    24.96
    25.01
    23.19
    28.47
    22.15
    21.05


    3.5
    20
    36.56
    34.60
    32.54
    31.48
    29.58
    28.88
    27.35
    27.10
    26.38


    3.5
    25
    37.05
    35.55
    31.79
    29.16
    28.68
    29.01
    26.72
    25.32
    24.62


    3.5
    Control
    47.61
    41.85
    37.02
    30.69
    29.55
    29.33
    27.84
    27.35
    26.75


    a*
    3
    15
    11.92
    9.63
    9.41
    8.78
    8.33
    7.96
    7.18
    7.01
    6.32


    3
    20
    15.42
    13.96
    9.07
    7.95
    7.46
    7.21
    6.62
    6.41
    6.01


    3
    25
    14.18
    13.56
    11.45
    10.99
    10.17
    9.72
    8.51
    7.99
    6.89


    3
    Control
    13.71
    9.65
    6.90
    4.82
    5.13
    3.74
    3.18
    3.00
    2.95


    3.5
    15
    20.28
    17.29
    13.09
    10.10
    9.42
    8.04
    6.85
    6.56
    6.15


    3.5
    20
    13.88
    11.00
    9.17
    10.15
    8.73
    7.28
    7.20
    7.00
    6.42


    3.5
    25
    12.22
    8.17
    8.06
    8.51
    7.38
    6.62
    6.39
    6.12
    6.00


    3.5
    Control
    14.5
    12.02
    9.39
    6.62
    5.83
    5.11
    4.78
    4.54
    4.02


    b*
    3
    15
    36.38
    35.75
    34.57

    34.39
    33.61
    32.15
    32.03
    31.02
    30.21


    3
    20
    41.88
    40.20
    38.73
    37.16
    35.89
    34.98
    34.08
    33.15
    32.45


    3
    25
    40.42
    39.04
    34.52
    33.77
    32.52
    31.63
    29.07
    28.32
    27.12


    3
    Control
    64.01
    37.57
    34.97
    29.88
    26.71
    26.37
    24.92
    24.24
    23.58


    3.5
    15
    45.2
    40.94
    38.23
    34.72
    31.96
    30.68
    29.76
    29.00
    28.65


    3.5
    20
    40.78
    37.88
    34.15
    31.90
    29.21
    28.95
    28.03
    27.21
    26.08


    3.5
    25
    37.45
    34.91
    31.72
    29.84
    28.73
    26.93
    25.55
    25.13
    24.67


    3.5
    Control
    44.65
    40.00
    35.59
    31.28
    30.45
    26.93
    25.41
    25.18
    24.68
Table 2: Variation in colour values during storage.
Colour a*–values decreased with the storage period indicating decrease in redness of the pulp (Table 2). Minimum change from 11.92 to 6.32 was observed at 3 pH, 15 min heating. The decrease in redness of the product may be due to the losses of pigments during storage. F–values for variation due to treatments and storage days are 13.68 and 41.75, indicating that variation in colour–a* value is also significant (Table 1). The colour–b* value ranged from 45.2 to 24.67 for heated samples. Colour b* value decreased with the storage period indicating decrease in yellowness. Minimum reduction was observed at 3pH and 15 minute heating period. The change was maximum in controlled samples.
Thermal conductivity
It is a measure of the ability of a substance to conduct heat. Thermal conductivity of samples was ranged from 0.37 to 0.758 W⁄m°C. (Figure. 4). The change in thermal conductivity in all the samples may be attributed to the various changes occurred due to different reactions and activity of microorganism in pulp. Minimum changes were observed for the samples, which were maintained at 3pH, heated for 15 minutes and stored at refrigeration conditions (p<0.05). Increase in thermal conductivity with storage for mango flash has also been reported by Suwapanich and Haewsungcharoen [18]. Inverse relation of thermal conductivity and TSS was also reported for Caja and blackberry juice by Tadini et al. and Cabral and Orreg–Alzate [19,20] respectively.
Specific heat
It is the amount of heat required to raise the temperature of one gram of a substance by 1°C. Specific heat of samples was ranged from 1.73 to 2.5 kJ⁄kg°C during storage till 80 days (Figure.5). Specific heat increased in all the samples with storage, however, comparatively higher increase was observed in controlled samples. Minimum changes were observed for samples, when processed to 3pH and 15 min heating. F–values showed significant variation in the data (Table 1). Increase in thermal conductivity with storage for mango flash has also been reported by Suwapanich and Haewsungcharoen [18].
Microbial load
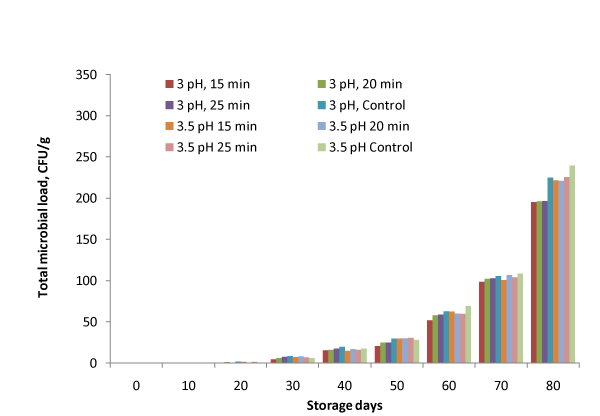
It can be observed from Figure. 6 that microbial load in terms of yeast and mold counts was not detected in samples till 10 days whereas the microbial load was under the limit prescribed FSSAI guidelines (100 CFU⁄g) for 60 days. Minimum microbial load in terms of yeast and molds count was observed for samples stored at 3 pH and 15 min heating of the bael pulp and was 98.7 CFU⁄g even after 70 days.
Sensory characteristics
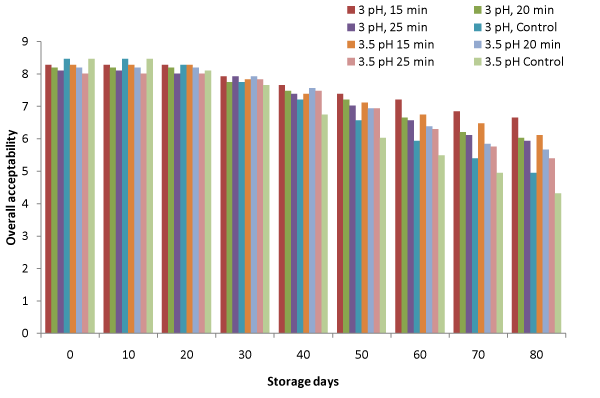
The overall acceptability of the product was maximum for control samples followed by 15 min heating for both pH levels initially, which reduced further after 20 days storage period (Figure. 7). Maximum sensory score of overall acceptability was 6.66 after 80 days at 3 pH and 15 min heating period, revealing that the product was acceptable even after 80 days under these pretreatment conditions. However, control samples were not acceptable after 80 days storage period.
Kinetics of change in responses during storage
It can be observed from Table 2 and Figure. 7 that bael pulp stored at 3 pH and 15 min heating got overall minimum changes in colour and attained maximum sensory score till 80 days storage period under refrigerated conditions. Therefore, the zero and first order kinetic models were fitted in order to describe the reaction rate as a function of storage period and predict the total soluble solids, pH, acidity, colour, thermal conductivity and specific heats of bael pulp stored at 3 pH and 15 min heating period.
Figure 6: Variation in microbial load (yeast and molds count) during storage.
Figure 7: Variation in sensory score during storage.
Table 3 shows the parameters, coefficient of determination, chisquared value, and root mean square error (RMSE) for variation of responses with storage period. In all the cases, the R2 value was higher than 0.799 for zero order and 0.828 for first order except pH. The chi–square and RMSE values were lower than 0.482 and 0.612 for zero order 0.460 and 0.598 for first order respectively. These values indicate that zero or first order models were very well fitted for all responses. After a close inspection of Table 3, it can be observed that zero order model can be better applied to predict the change in total soluble solids and colour–b* values; whereas first order model is justified for change in titratable acidity, colour–L*, colour–a*, thermal conductivity and specific heat of bael pulp.
    S. No.
    Response
    Zero Order
    First    Order


    K0
    C0
    R²
    ?²
    RMSE
    K1
    Co
    R²
    ?²
    RMSE


    1
    TSS
    -0.045
    25.578
    0.896
    1.75E-01
    3.68E-01
    -0.002
    25.636
    0.895
    2.16E-01
    4.10E-01


    2
    pH
    -0.001
    3.024
    0.525
    4.36E-04
    1.84E-02
    0.000
    3.025
    0.525
    6.87E-04
    2.31E-02


    3
    Acidity
    0.002
    0.126
    0.870
    7.13E-04
    2.36E-02
    0.008
    0.133
    0.888
    1.72E-04
    1.16E-02


    4
    Colour-L*
    -0.056
    30.743
    0.837
    4.82E-01
    6.12E-01
    -0.002
    30.753
    0.848
    4.60E-01
    5.98E-01


    5
    Colour-a*
    -0.059
    10.874
    0.919
    2.52E-01
    4.43E-01
    -0.007
    11.012
    0.957
    1.89E-01
    3.83E-01


    6
    Colour-b*
    -0.077
    36.425
    0.986
    6.96E-02
    2.33E-01
    -0.002
    36.525
    0.985
    1.79E-01
    3.73E-01


    7
    Thermal    Conductivity
    0.004
    0.316
    0.799
    2.74E-03
    4.61E-02
    0.008
    0.337
    0.828
    3.41E-03
    5.15E-02


    8
    Specific    Heat
    0.006
    1.722
    0.938
    1.64E-03
    3.58E-02
    0.003
    1.733
    0.949
    3.41E-02
    1.63E-01
Table 3: Kinetic parameters from zero- and first-order reactions of responses of bael pulp stored with 3pH, 15 min heating in refrigerated condition.
It can be observed from Table 4 that TSS, pH, colour (L*, a* and b*) values are negatively correlated with storage time, whereas, titratable acidity, thermal conductivity and specific heat are positively correlated. It can further be noted that pH is negatively correlated with acidity. Similar trend has also bee observed for apple pulp by Muhammad et al. [17]. The data signify the importance to exhibit the trend of different parameters during treatment and then storage.
    Storage    days
    TSS
    pH
    Acidity
    Colour
    Thermal    Cond.
    Specific    Heat


    L*
    a*
    b*


    Storage    days
    1.00


    TSS
    -0.95
    1.00


    pH
    -0.72
    0.77
    1.00


    Acidity
    0.93
    -0.95
    -0.81
    1.00


    Colour-L*
    -0.91
    0.77
    0.61
    -0.78
    1.00


    Colour-a*
    -0.96
    0.85
    0.62
    -0.84
    0.96
    1.00


    Colour-b*
    -0.99
    0.96
    0.73
    -0.93
    0.91
    0.94
    1.00


    Thermal    Cond.
    0.89
    -0.90
    -0.89
    0.97
    -0.77
    -0.80
    -0.88
    1.00


    Specific    Heat
    0.97
    -0.95
    -0.79
    0.99
    -0.85
    -0.89
    -0.96
    0.97
    1.00
Table 4: Correlation matrix for parameters of bael pulp stored with 3pH, 15 min heating and in refrigerated condition.
Conclusion
The TSS, pH, titratable acidity, colour–L*, a*, b*, thermal conductivity and specific heat ranged between 18–25°Brix, 2.6–3.5, 0.15–0.35%, 20.32–56.87, 2.95–20.28, 23.58–64.01, 0.37–0.76 w⁄m°C, 1.73–2.50 J⁄g°C respectively. The pulp can be stored for 60 days under the refrigerated conditions. Minimum colour change and maximum sensory score was observed of the sample at 3 pH and 15 min heating. The zero or first order models were very well fitted for all responses. Zero order model can be better applied to predict the change in total soluble solids and colour–b* values; whereas first order model is justified for change in titratable acidity, colour–L*, colour–a*, thermal conductivity and specific heat of bael pulp. The properties of bael pulp also correlated with the storage period.
References
- Kaushik RA, Yamdagni R, Dhawan SS. Physico-chemical characteristics of Bael fruit at green and ripe stage of maturity, Haryana Journal Horticultural Science. 2000; 29: 44-45.
- Singh A, Kumar S and Sharma HK. Effect of enzymatic hydrolysis on the juice yield from Bael fruit (Aegle marmelos Correa) pulp, American Journal of Food Technology. 2012; 7: 67-72.
- Bag SK, Srivastav PP and Mishra HN. Desorption and adsorption characteristics of Bael (Aegle marmelos) pulp and powder. International Food Research Journal. 2009; 16: 561-569.
- Charoensiddhi and Anprung Pranee. Characterization of bael fruit (Aegle marmelos L. Correa) hydrolysate as affected by enzyme treatment. Journal of Food Biochemistry. 2010; 34: 1249-1267.
- Rajan S, Gokila M, Jency P, Brindha P, Sujatha RK. Antioxidant and phytochemical properties of Aegle marmelos fruit pulp. Int Current Pharmaceutical Research. 2011; 3: 65-70.
- Carbonera L, Carciof BM, Huber E, Laurindo JB. Experimental Determination of the Thermal Diffusivity of a Commercial Tomato Pasta . Brazilian Journal of Food Technology. 2003; 6: 285-290.
- Roy SK. Studies of Bael fruit (Aegle marmelos Correa)-changes in constituents during development, ripening and storage and processing of fruit, Doctoral thesis, BCKVV, Kalyani, India. 1975.
- Ranganna S. Handbook of analysis of quality control of fruit and vegetable product. 2nd Ed., Tata McGraw-Hill Publ. Co., New Delhi. (2008).
- Koburger JA, Marth EH 1984 Yeasts and Molds, In: M.L. Speck. (2nd ed), Compendium of Methods for the Microbiological Examination of Foods. American Public Health Association, Washington. D.C.; 197-201.
- Singh, R.P 2000 "Scientific principles of shelf-life evaluation", in Man, C.M.D. and Jones, A.A. (Eds), Shelf Life of Foods, Aspen Publishers, Gaithersburg, MD, 3-22.
- Kumar N, Sarkar BC, Sharma HK and Jha SK. Colour kinetics and storage characteristics of carrot, pulse and rice by-product based extrudates, British Food Journal. 2012; 114: 1279 - 1296.
- Rai P, Rai Chhaya, Majumdar GC, Dasgupta S, De S. Storage study of ultrafiltered mosambi (Citrus sinensis (l.) Osbeck) juice. Journal of Food Processing and Preservation. 2008; 32 923-934.
- Ertekin C and Yaldiz O. Drying of eggplant and selection of a suitable thin layer drying model, Journal of Food Engineering. 2004; 63: 349-359.
- Kumar N, Sarkar BC, Sharma HK . Mathematical modelling of thin layer hot air drying of carrot pomace. J Food Sci Technol. 2012; 49: 33-41.
- Bhattacherjee AK, Dikshit A, Kumar S and Tandon DK. Quality evaluation in storage of aonla (Emblica officinalis Gaertn.) juice extracted from fruits preserved by steeping in water, Food Research International Journal. 2013; 20: 1861-1865.
- Kinh SAEH, Dunne CP and Hoover DG. Preparation and preservation of apple pulp with chemical preservatives and mild heat, Journal of Food Protection. 2001; 28: 111-114.
- Muhammad A, Ayub Muhammad ZA, Durrani Y, Ullah J and Afridi S. Physicochemical analysis of apple pulp from Mashaday variety during Storage. Agriculture And Biology Journal Of North America. 2011; 2: 192-196.
- Suwapanich R and Haewsungcharoen M. Effect of temperature on thermal properties of Mango Nam Dok Mai cv. Si Thong during storage. Journal of Agricultural Technology. 2007; 3: 137-142.
- Tadini CC, Telis VRN, Telis-Romero J. Influence of temperature and concentration on thermophysical properties of caja juice (Spondia mombin, L), Eurotherm Seminar 77 - Heat and Mass Transfer in Food Processing, Panama, Italy. 2006.
- Cabral RAF, Orreg-Alzate CE, Ana Lúcia GABAS3, Javier TELIS-ROMERO. Rheological and thermophysical properties of blackberry juice, Ciênc. Tecnol. Aliment., Campinas. 2007; 27: 589-596.
