Case Report
Austin J Psychiatry Behav Sci. 2014;1(1): 1001.
Incidence of Weight Gain and Hyper Lipidemia with a Typical Antipsychotic Treatment: A Prospective Community Based Clinical Study
Antony S Amaladoss1*, Christopher Balram2 and Wang A3
1Department of psychiatry and behavioral science,McMaster University, Canada
2Department of Health & Wellness, University of Prince Edward Island, Canada
3Department of Health Fredericton, University of New Brunswick, Canada
*Corresponding author: Antony S Amaladoss, Joseph Brant Memorial Hospital, Burlington, Ontario, Canada
Received: January 20, 2014; Accepted: February 24, 2014; Published: March 05, 2014
Abstract
Atypical Antipsychotic (AAPS) have been found to be effective in various psychiatric conditions however evidence of treatment, emergent weight gain and hyperlipidemia limit their clinical benefits.
Objective: To determine the incidence of treatment emergent weight gain and hyperlipidemia with atypical antipsychotics.
Method: Patients with schizophrenic and non-schizophrenic conditions were randomly started on AAPS .Weight, BMI, triglycerides were measured every 3 months from the base line for one year.
121 enrolled, 119 completed the one year follow up study.
Male : 69; Female: 50; Olanzapine: 51; Risperidone: 59; Quetiapine: 8; Clozapine: 1.
Data Analysis: Descriptive and inferential analysis was carried out except Clozapine to examine the effects on weight, BMI and triglycerides.
Limitataions: Polypharmacy and ethnicity were not considered.
Results:
Mean Weight Gain:
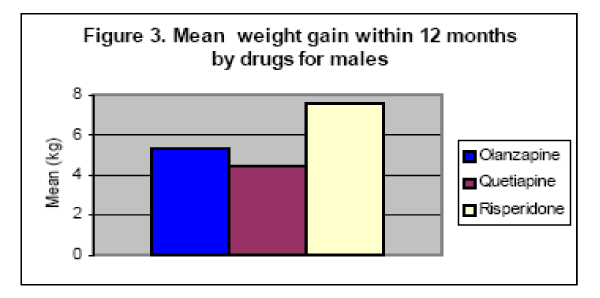
Males: Risperidone 7.5 kg > Olanzapine 5.353 kg > Quetiapine 4.43 KG.
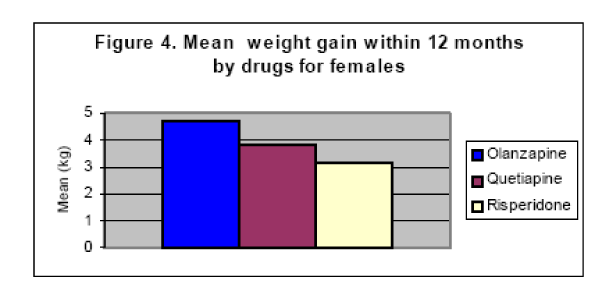
Females: Olanzapine 4.71 grams >Quetiapine 3.81 grams >Risperidone 3.14 kg.
Percentage of weight gain – more than 7%:
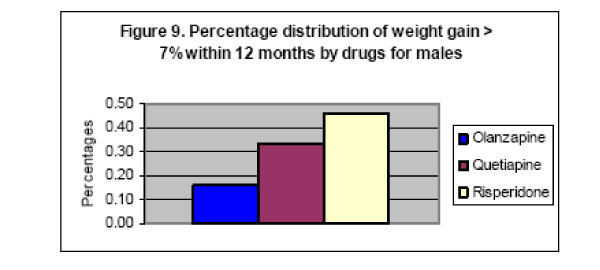
Males: Risperidone 46% > Quetiapine 33%>Olanzapine 16%
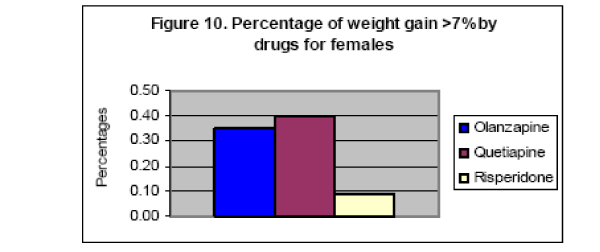
Females: Quetiapine 40% >Olanzapine 35% >Risperidone 9%
BMI
Overweight:
Males: Quetiapine 100%> Olanzapine 58.06%> Risperidone 51.35%
Females: Quetiapine 80%> Risperidone 50% >Olanzapine 45%
Obesity
Females: Risperidone 50%> Quetiapine 20% >Olanzapine 20%
Mean Triglycerides
Males: Risperidone 1.92> Olanzapine 1.7
Females: Olanzapine 1.97 > Risperidone 1.78
Percentage of Hyperlipidemia
Males: Olanzapine 54.84% >Risperidone 43.24%>Quetiapine 33.33%
Females: Quetiapine 80% > Olanzapine 65% > Risperidone 45.45%
Hyper Lipidemia Related to Age and Disease
Risperidone – Mostly seen in the 20 to 40 years age group
Olanzapine – Mostly seen in 61 years plus.
Olanzapine seems to be having more propensity to induce hyper–lipidemia in Schizophrenia and Bi–polar disorder.
Odd ratio
Olanzapine Vs Risperidone – 1.81% (S.e.(O) 0.70034827).
Conclusion: The results show that atypical antipsychotic do affect weight, BMI and Triglycerides in varying degree and in relation to age, gender and disease which has significant clinical implications that warrant close monitoring with ongoing education on life style, diet and exercise in a heuristic manner.
Introduction & Background
Patients with chronic psychiatric disorders are at increased risk for morbidity and mortality resulting from various medical diseases including respiratory diseases, infectious diseases, obesity, diabetes mellitus and cardiovascular disease [1].
In patients with schizophrenia and affective disorder the prevalence of risk factor for cardiovascular disease is approximately 1.5 to 2 times higher than the rate in the general population [2].
Mood disorders associated with obesity and it has been postulated gluco–corticoids play a central role in that role in the patho genesis ofmetabolic syndrome [3,4].
It has been evidenced all atypical antipsychotics induce weight gain and hyperlipidemia [5–7]. However, nearly all psychotropic medications induce weight gain [8–10].
The use of the atypical anti–psychotics is not confined to the treatment of schizophrenia but used to treat a broad array of other psychiatric disorders for which it has been found effective [11].
Recently there is a general consensus of varying adverse effects on weight and triglycerides with atypical antipsychotic have been proposed [12–18].
Hence this one year prospective study has been undertaken to quantify the incidence of weight gain and hyperlipidemia due to atypical anti–psychotics, which may enhance physicians in their clinical decision making.
Objective
To determine treatment effects of atypical antipsychotics on weight and triglycerides in both schizophrenic and non–schizophrenic conditions in a community setting.
Methods
Patients with schizophrenic and non —schizophrenic conditions were started randomly on atypical antipsychotics. Weight, BMI and triglycerides were measured every 3 months from the baseline for one year. There were 121 patients were enrolled in the study and 119 of them completed the one year follow up. There were 69 males and 50 females.
Treatment breakdown was as follows:
Olanzapine 51: risperidone 59: quetiapine 8: and Clozapine 1
The variables included in the analysis were
BMI– overweight is more than 25 to 29.9, Obesity is above 30
Hyperlipidemia is more than 1.7mmol⁄l.
Analysis and Interpretation
Descriptive and inferential analyses were carried out to examine the treatment effects on weight, BMI and triglycerides and in relationships to age, gender and disease. Clozapine was omitted from the analysis as there was only one patient.
The number of patients treated with Quetiapine is low compared to Olanzapine and Risperidone, yet, included as it is statistically viable, but, this needs to be taken into consideration while interpreting the results. It should be noted that polypharmacy and ethnicity were not taken into consideration.
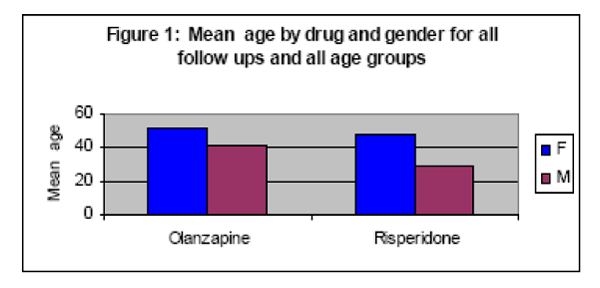
The study reveals that more males were treated with atypical antipsychotics than females. Descriptive projection of drugs, age, gender and diagnosis can be seen in tables 1–4 & Figure 1. The age group under 19 years had been treated mostly with risperidone. A higher percentage of obesity 42.42% has been seen in schizophrenic patients and this validates the question of whether it is due to drugs or lifestyle or disease related. The mean weight gain more in females with risperidone , 7.57 kg SD 8.34 and more in females with olanzapine 4.71 kg SD 4.67.
Figure 1 :Mean age by drug and gender for all follow ups and all age groups.
    Number of    patients


    F
    M


    Clozapine
      Olanzapine
      Quetiapine
      Risperidone
    1
      20
      5
      22
    0
      31
      3
      37
Table 1: Frequency distribution of antipsychotic drug use by gender.
    Number of    patients


    Age-groups
    Olanzapine
    Quetiapine
    Risperidone


    0-19
    3
    2
    20


    20-40
    18
    1
    14


    41-60
    17
    5
    16


    61+
    13

    9


    Total
    51
    8
    59
Table 2: Frequency distribution of antipsychotic drug use by age-groups and drugs for gender combined.
    Frequency
    Percent


    Attention Deficit Disorder (ADD)
    17
    14.29


    Anxiety Disorder (Anx)
    4
    3.36


    Behavioural Disorder (Beh)
    2
    1.68


    Bipolar Disorder (Bipolar)
    21
    17.65


    Mood Disorder (Mood)
    23
    19.33


    Organic Brain Syndrome (OBS)
    9
    7.56


    PDD
    1
    0.84


    Schizophrenia (Schizo)
    41
    34.45


    Schizophrenia With Diabetes (Schizo with    Dia)
    1
    0.84


    Total
    119
    100
Table 3: Frequency (count and percentage) distribution of patients by diagnosis.
    Female

    Msale


    Olanzapine
    Risperidone
    Olanzapine
    Risperidone


    Age
    51
    47
    41
    28
Table 4: Mean age by drug and gender for all follow ups and age-groups.
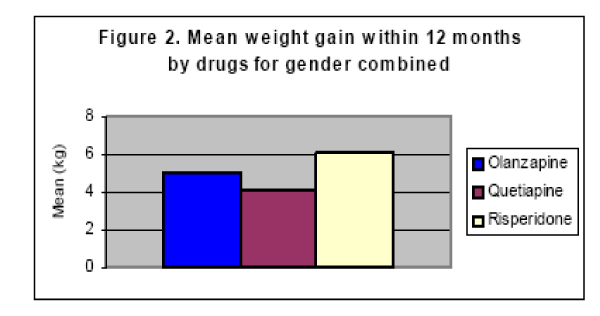
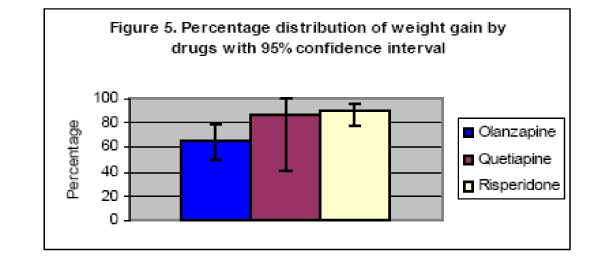
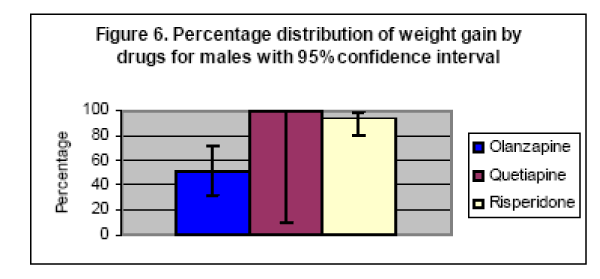
The percentage of weight gain distribution seen more in males with risperidone 94.5% CI 79.87,99.10 than with Olanzapine 51.61% CI, 31.67 to 71.55 (Tables 5–11; Figures 2–5).
Figure 2: Mean weight gain within 12 months by drugs for gender combined.
Figure 3: Mean weight gain within 12 months by drugs for males.
Figure 4: Mean weight gain within 12 months by drugs for females.
Figure 5: Percentage distribution of weight gain by drugs with 95% confidence interval.
    Mean
    Standard Deviation
    Maximum


    Olanzapine
    5.02
    4.57
    18


    Quetiapine
    4.1
    3.06
    9.6


    Risperidone
    6.06
    7.27
    40.92
Table 5: Descriptive statistics of weight gain by drugs.
    Mean
    Standard Deviation
    Maximum


    Olanzapine
    5.35
    4.58
    15.00


    Quetiapine
    4.43
    4.57
    9.60


    Risperidone
    7.57
    8.34
    40.92
Table 6: Descriptive statistics of weight gain by drugs for males.
    Mean
    Standard Deviation
    Maximum


    Olanzapine
    4.71
    4.67
    18


    Quetiapine
    3.85
    2.14
    5.46


    Risperidone
    3.14
    3.03
    12.82
Table 7: Descriptive statistics of weight gain by drugs for females.
    Weight gain
    Lower Cl
    Upper Cl


    Olanzapine
    64.71
    50.29
    79.13


    Quetiapine
    87.50
    40.25
    99.52


    Risperidone
    89.83
    78.23
    95.87
Table 8: Percentage distribution of weight gain by drugs.
    Total in sample
    Number with weight gain
    Proportions with weight gain


    Olanzapine
    51
    33
    0.647


    Quetiapine
    8
    7
    0.875


    Risperidone
    59
    53
    0.898


    Overall
    118
    93
    0.788
Table 9: Significance testing of percentages of weight gain by drugs.
    pi
    0.788


    qi
    0.212


    n1.*(p1-p(total))^2
    1.015035402


    n2.*(p2-p(total))^2
    0.060363401


    n3.*(p3-p(total))^2
    0.716101695
Table 10: Conclusion: The three proportions are significantly different at 0.01 level.
    Total in sample
    Number with weight gain
    Proportions with weight gain


    Olanzapine
    31
    16
    0.516


    Quetiapine
    3
    3
    1.000


    Risperidone
    37
    35
    0.946


    Overall
    71
    54
    0.761
Table 11: Significance testing of percentages of weight gain by drugs for males.
Figure 6: Percentage distribution of weight gain by drugs for males with 95% confidence interval.
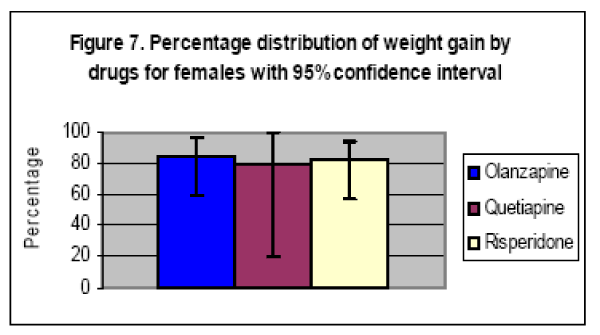
Figure 7: Percentage distribution of weight gain by drugs for females with 95% confidence interval.
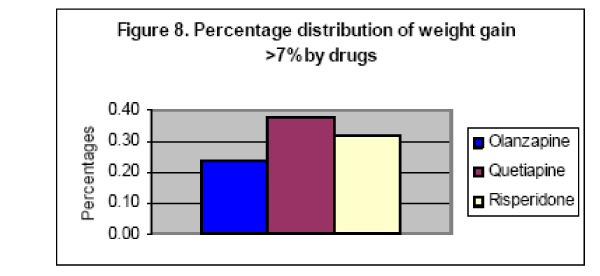
Weight gain more than 7% has been seen in males with risperidone 46% , with quetiapine 33% and with olanzapine 16% and in females , quetiapine 40% ,with Olanzapine 35% and risperidone 9% (Tables 12–16; Figures 8–10).
Figure 8: Percentage distribution of weight gain >7% by drugs.
Figure 9: Percentage distribution of weight gain >7% with 12 months by drugs for males.
Figure 10: Percentage of weight gain >7% by drugs for females.
    pi
    0.761


    qi
    0.239


    n1.*(p1-p(total))^2
    1.852192665


    n2.*(p2-p(total))^2
    0.086917157


    n3.*(p3-p(total))^2
    0.499235315


    Total
    2.438345137


    X2
    13.40641381s
Table 12:  Conclusion: The three proportions for males are significantly different at 0.01
level.
    Total in sample
    Number with weight gain
    Proportions with weight gain


    Olanzapine
    20
    17
    0.850


    Quetiapine
    5
    4
    0.800


    Risperidone
    22
    18
    0.818


    Overall
    47
    39
    0.830
Table 13: Significance testing of percentages of weight gain by drugs for females.
    pi
    0.83


    qi
    0.17


    n1.*(p1-p(total))^2
    0.008171118


    n2.*(p2-p(total))^2
    0.004436397


    n3.*(p3-p(total))^2
    0.002963085


    Total
    0.0155706


    X2
    0.110351521
Table 14: Conclusion: The three proportions for females are not significantly different at 0.01 level.
    Counts with weight gain > 7%
    Total in sample
    Percent


    Olanzapine
    12
    51
    0.24


    Quetiapine
    3
    8
    0.38


    Risperidone
    19
    59
    0.32


    Total
    34
    118
    0.29
Table 15: Percent distribution of weight gain >7% within 12 months by drugs.
    Counts with weight gain > 7%
    Total in sample
    Percent


    Olanzapine
    5
    31
    0.16


    Quetiapine
    1
    3
    0.33


    Risperidone
    17
    37
    0.46
Table 16: Percent distribution of weight gain >7% within 12 months by drugs for males.
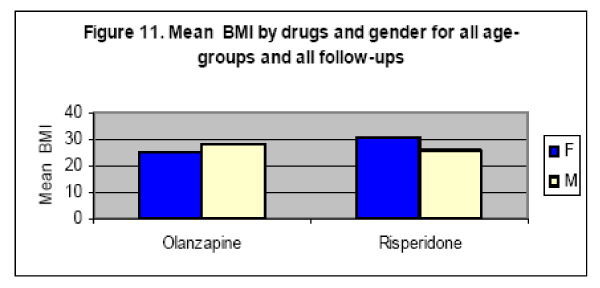
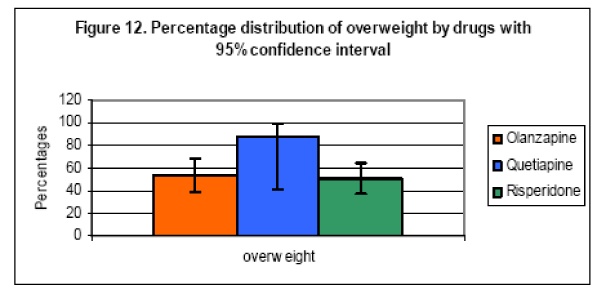
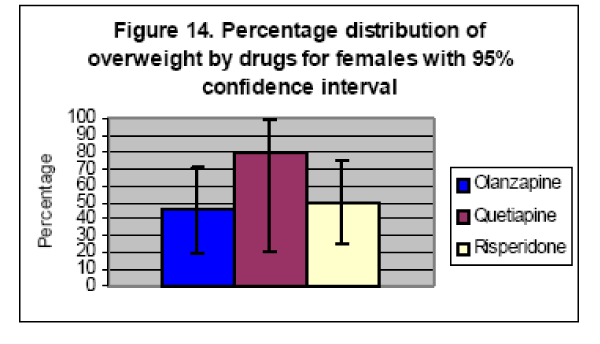
Overweight range has been seen in males with quetiapine 100% , with olanzapine 58.06% and with risperidone 51.35% and in females with Quetiapine 90% , with Risperidone 51.35% and in females with Quetiapine 45% . OR is equal to 1.31%, 95% CI (.14,1.51 for gender combined) (Tables 17–22; Figures 11–15).
Figure 11: Mean BMI by drugs and gender for all age groups and all followups.
Figure 12: Percentage distribution of overweight by drugs with 95% confidence interval.
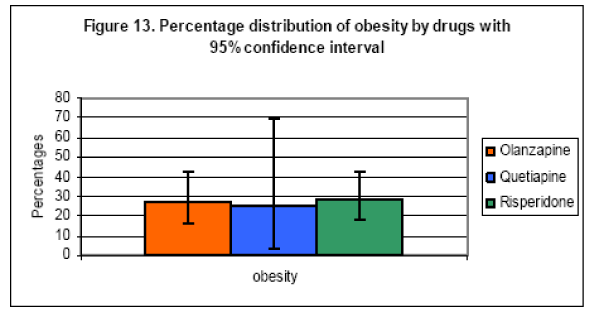
Figure 13: Percentage distribution of obesity by drugs with 95% confidence interval.
Figure 14: Percentage distribution of overweight by drugs for females with 95% confidence interval.
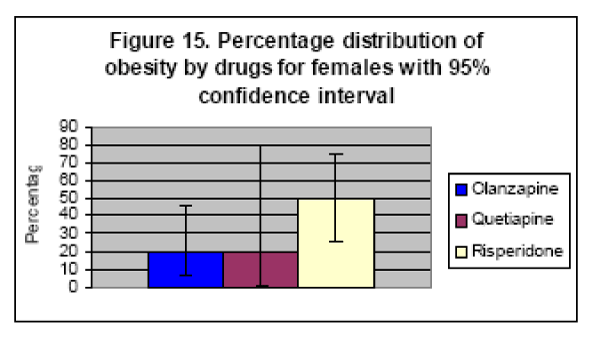
Figure 15: Percentage distribution of obesity by drugs for females with 95% confidence interval.
    Counts with weight gain > 7%
    Total in sample
    Percent


    Olanzapine
    7
    20
    0.35


    Quetiapine
    2
    5
    0.40


    Risperidone
    2
    22
    0.09
Table 17: Percent distribution of weight gain >7% within 12 months by drugs for females.
    Total in sample
    Number with weight gain > 7%
    Number with weight gain <=7%
    Proportions with weight gain > 7%


    Olanzapine
    51
    12
    39
    0.235


    Quetiapine
    8
    3
    5
    0.375


    Risperidone
    59
    19
    40
    0.322


    Overall
    118
    34
    84
    0.288
Table 18: For gender combined.
    pi
    0.288135593


    qi
    0.711864407


    n1.*(p1-p(total))^2
    2.823529412


    n2.*(p2-p(total))^2
    1.125


    n3.*(p3-p(total))^2
    6.118644068


    Total
    10.06717348


    X2
    49.08099563
Table 19: Conclusion: The three proportions for gender combined are significantly different at 0.01 level.
    Total in sample
    Number with weight gain > 7%
    Number with weight gain <=7%
    Proportions with weight gain > 7%


    Olanzapine
    31
    5
    26
    0.161


    Quetiapine
    3
    1
    2
    0.333


    Risperidone
    37
    17
    20
    0.459


    Overall
    71
    23
    48
    0.324
Table 20: For male.
    pi
    0.761


    qi
    0.239


    n1.*(p1-p(total))^2
    0.806451613


    n2.*(p2-p(total))^2
    0.333333333


    n3.*(p3-p(total))^2
    7.810810811


    Total
    8.950595757


    X2
    49.21181531
Table 21: Conclusion: The three proportions for males are significantly different at 0.01 level.
    Olanzapine
    Quetiapine


    F
    25.22
    30.31


    M
    28.24
    25.88
Table 22: Mean BMI by drugs and gender for all age-groups and all follow-ups.
Obesity range has been seen in males with quetiapine 33.33%, with Olanzapine 32.26% and with Risperidone 16.22% and with females with Risperidone 50% , olanzapine 20% and with Quetiapine 20% . OR is 1.12, 95%CI (–4.81 ,2.34).
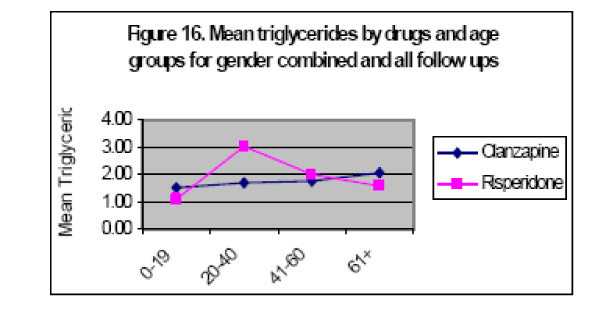
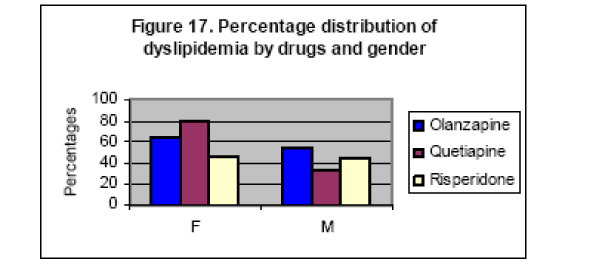
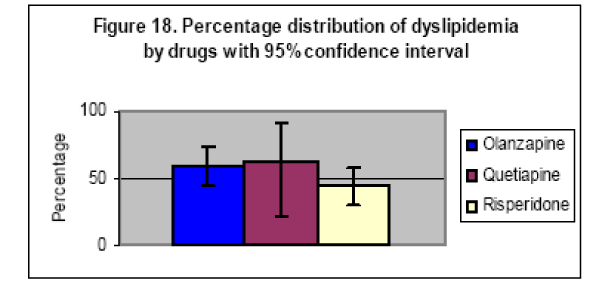
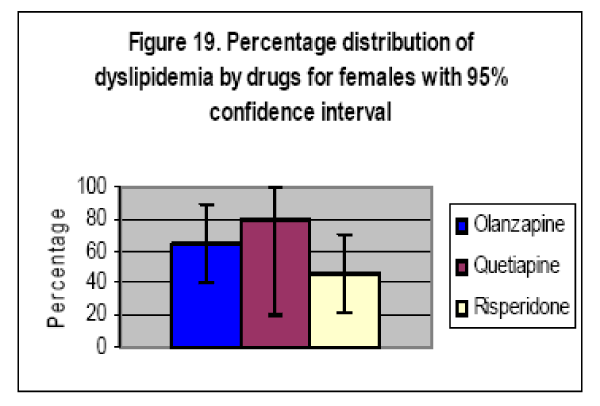
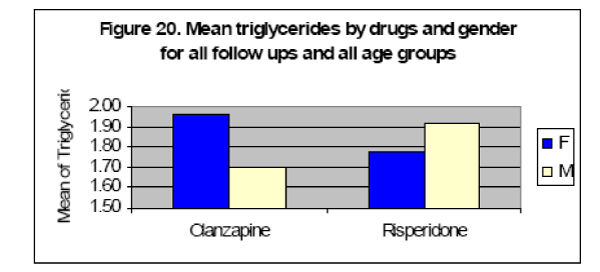
It is interesting to note that the mean of triglycerides for males with Risperidone 1.92 > Olazapine 1.7 and in female Olanzapine 1.97> Risperidone 1.78 and this correlates with the observed weight gain pattern as shown above (Tables 23–28; Figures16–19).
Figure 16: Mean triglycerides by drugs and age groups for gender combined and all follow ups.
Figure 17: Percentage distribution of dyslipidemia by drugs and dender.
Figure 18: Percentage distribution of dyslipidemia by drugs with 95% confidence interval.
Figure 19: Percentage distribution of dyslipidemia by drugs for females with 95% confidence interval.
    Overweight
    obesity


    Olanzapine

    F
    45
    20


    M
    58.06
    32.26


    Quetiapine
    F
    80
    20


    M
    100
    33.33


    Risperidone
    F
    50
    50


    M
    51.35
    16.22
Table 23: Percentage distribution of overweight and obesity by drugs and gender.
    Total in sample
    Number with over weight
    Proportions with over weight


    Olanzapine
    51
    27
    0.529


    Quetiapine
    8
    7
    0.875


    Risperidone
    59
    30
    0.508


    Overall
    118
    64
    0.542
Table 24: Significance testing of percentages of overweight by drugs.
    pi
    0.542


    qi
    0.457627119


    n1.*(p1-p(total))^2
    0.008567518


    n2.*(p2-p(total))^2
    0.8851264


    n3.*(p3-p(total))^2
    0.06779661


    Total
    0.961490528


    X2
    3.87378302
Table 25: Conclusion: The three proportions are not significantly different at 0.01 level.
    Total in sample
    Number with over weight
    Proportions with over weight


    Olanzapine
    20
    9
    0.450


    Quetiapine
    5
    4
    0.800


    Risperidone
    22
    11
    0.500


    Overall
    47
    24
    0.511
Table 26: Significance testing of percentages of overweight by drugs for females.
    pi
    0.510638298


    qi
    0.489361702


    n1.*(p1-p(total))^2
    0.073540063


    n2.*(p2-p(total))^2
    0.418650973


    n3.*(p3-p(total))^2
    0.002489814


    Total
    0.494680851


    X2
    1.979619565
Table 27: Conclusion: The three proportions for females are not significantly different at 0.01 level.
    Total in sample
    Number with obesity
    Proportions with obesity


    Olanzapine
    51
    14
    0.275


    Quetiapine
    8
    2
    0.250


    Risperidone
    59
    17
    0.288


    Overall
    118
    33
    0.280
Table 28: Significance testing of percentages of obesity by drugs.
Figure 20: Mean triglycerides by drugs and gender for all follow ups and all age groups.
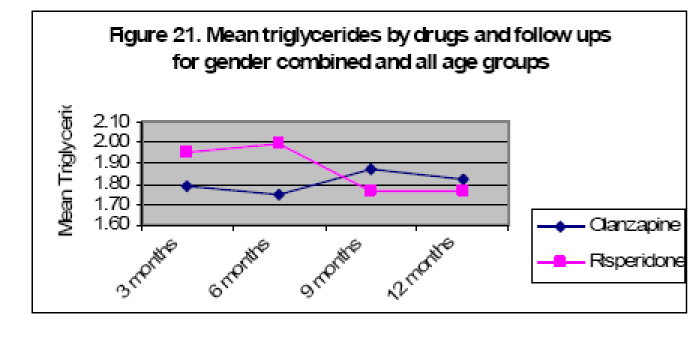
Figure 21: Mean triglycerides by drugs and follow ups fro gender combined and all age groups.
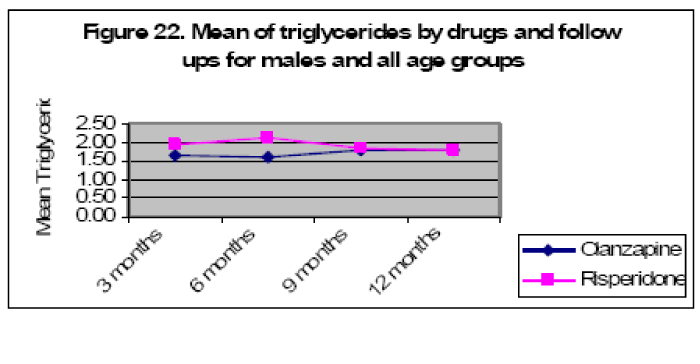
Figure 22: Mean of triglycerides by drugs and follow ups for male and all age groups.
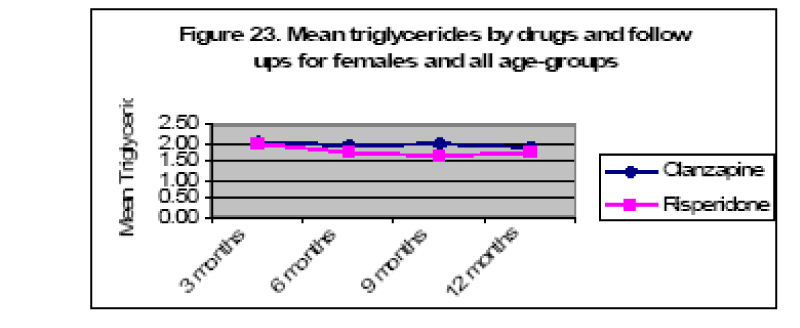
Figure 23: Mean triglycerides by drugs and follow ups for females and all age–groups.
    pi
    0.280


    qi
    0.720338983


    n1.*(p1-p(total))^2
    3.659282041


    n2.*(p2-p(total))^2
    0.683855214


    n3.*(p3-p(total))^2
    3.813559322


    Total
    8.156696577


    X2
    40.48978365
Table 29: Conclusion: The three proportions are significantly different at 0.01 level.
    Total in sample
    Number with obesity
    Proportions with obesity


    Olanzapine
    31
    10
    0.323


    Quetiapine
    3
    1
    0.333


    Risperidone
    37
    6
    0.162


    Overall
    71
    17
    0.239
Table 30: Significance testing of percentages of obesity by drugs for males.
    pi
    0.239


    qi
    0.76056338


    n1.*(p1-p(total))^2
    1.797518414


    n2.*(p2-p(total))^2
    0.094311151


    n3.*(p3-p(total))^2
    4.493117835


    Total
    6.3849474


    X2
    35.06156846
Table 31: Conclusion: The three proportions for males are significantly different at 0.01 level.
    0-19
    20-40
    41-60
    61+


    Olanzapine
    1.49
    1.70
    1.76
    2.07


    Risperidone
    1.07
    3.03
    2.00
    1.57
Table 32: Mean triglycerides by drugs and age-groups for gender combined and all follow ups.
    F
    M


    Olanzapine
    65
    54.84


    Quetiapine
    80
    33.33


    Risperidone
    45.45
    43.24
Table 33: Percentage distribution of dyslipidemia by gender and groups.
    dyslipidemia
    Lower Cl
    Upper Cl


    Olanzapine
    58.82
    43.99
    73.65


    Quetiapine
    62.5
    21.75
    91.75


    Risperidone
    44.07
    30.28
    57.86
Table 34: Percentage distribution of dyslipidemia by drugs.
    Total in sample
    Number with dyslipidemia
    Proportions with dyslipidemia


    Olanzapine
    31
    17
    0.548


    Quetiapine
    3
    1
    0.333


    Risperidone
    37
    16
    0.432


    Overall
    71
    34
    0.479
Table 35: Significance testing of percentages of dyslipidemia by drugs for males.
    pi
    0.479


    qi
    0.521126761


    n1.*(p1-p(total))^2
    0.149797467


    n2.*(p2-p(total))^2
    0.174437906


    n3.*(p3-p(total))^2
    0.746442685


    Total
    1.070678058


    X2
    4.290372091
Table 36: Conclusion: The three proportions for males are not significantly different at 0.01 level.
    Total in sample
    Number with dyslipidemia
    Proportions with dyslipidemia


    Olanzapine
    20
    13
    0.650


    Quetiapine
    5
    4
    0.800


    Risperidone
    22
    10
    0.455


    Overall
    47
    27
    0.574
Table 37: Significance testing of percentages of dyslipidemia by drugs for females.
    pi
    0.574


    qi
    0.425531915


    n1.*(p1-p(total))^2
    0.114101403


    n2.*(p2-p(total))^2
    0.254323223


    n3.*(p3-p(total))^2
    0.316391621


    Total
    0.684816248


    X2
    2.801405724
Table 38: Conclusion: The three proportions for females are not significantly different at 0.01 level.
    F
    M


    Olanzapine
    Risperidone
    Olanzapine
    Risperidone


    1.97
    1.78
    1.70
    1.92
Table 39: Mean triglycerides by drug and gender for all follow ups and all age groups.
    3 Months
    6 Months
    9 Months
    12 Months


    Olanzapine
    1.79
    1.75
    1.87
    1.82


    Risperidone
    1.95
    2.00
    1.76
    1.76
Table 40: Mean triglycerides by drugs and follow ups for gender combined and all age groups.
    3 Months
    6 Months
    9 Months
    12 Months


    Olanzapine
    1.64
    1.62
    1.78
    1.77


    Risperidone
    1.94
    2.14
    1.82
    1.77
Table 41: Mean triglycerides by drugs and follow ups for males and all age groups.
    3 Months
    6 Months
    9 Months
    12 Months


    Olanzapine
    2.02
    1.95
    2.00
    1.90


    Risperidone
    1.98
    1.76
    1.67
    1.74
Table 42: Mean triglycerides by follow ups and drugs for females and all age groups.
    dyslipidemia
    Normal triglycerides


    Olanzapine
    30
    21


    Risperidone
    26
    33


    OR
    1.81


    s.e.(o)
    0.70034827
Table 43: The standard error is used to gauge the precision of the estimated odds ratio. OR represents Odds Ratio. s.e.(o) represents standard error of the odds ratio.
The percentage of hyper lipidemia for males with Olanzipine 54.84%> Risperidone 43.24% > Quetiapine 33.33% and for females Quetiapine 80%> Olanzapine 65% > Risperidone 45.45%.
Age related incidence
The highest incidence of hyperlipidemia seen between the age group of 20 to 40 years with Risperidone and for Olanzapine it has been evidenced in the age group of 61 +.
It is evidenced higher incidence of weight gain and hyperlipidemia in schizophrenia and bipolar disorder compared to other conditions (Tables 29–32; Figures 20–23).
The Odd Ratio for hyperlipidemia with Olanzapine Vs Risperidone is 1.81(SE (O) .77034827)
Discussion
This is the only study, to the author’s knowledge which examined the effects of treatment with, atypical anti psychotics in both schizophrenic and non–schizophrenic patients in a non– academic community setting and attempted to examine the effects in relation to age, gender and disease.
The study reveals alterations in weight seen from the baseline in all three atypical anti–psychotics but showing a differential trend in relation to age, gender and disease. It shows that males gain more weight with risperidone and females gain more weight with Olanzapine.
It is also evidenced that all three drugs induce hyperlipidemia in varying degree, but, showing a differential trend in relation to age, gender and disease.
One could see that male seems to be having more propensities with Risperidone and female with Olanzapine and similar pattern is shown with the weight gain. This reveals probable correlation exists between weight gain and hyperlipidemia.
In terms of age, it is quite interesting to note that the highest propensity for hyper lipidemia is seen in the age group of 20 to 40 years with Risperidone and Quetiapine, whereas, the highest incidence seen in the age group of 61 years plus with Olanzapine. This may signify importance in the clinical scenario and may enhance physicians decision making in their clinical management enlightening the need to do close monitoring when they prescribe either of the atypical for any particular gender or the age group.
Conclusion
This is the first study to the author’s knowledge revealing varying effects with atypical anti–psychotics treatment on weight, and triglycerides and in relationship to age, gender and disease.
It is evidenced in this prospective study that atypical antipsychotics do affect weight, BMI and triglycerides at varying degrees and there is no conclusive explanation to date of these effects attributed solely to the pharmacodynamic profile of the drugs.
It may be beneficial to be cognizant of these adverse varying effects of the drugs, in relation to age, gender and disease which may induce metabolic or cardiovascular morbidities. It is prudent to advocate individual close monitoring with ongoing education on life style, diet, and exercise rather discriminating the drugs with heightened risk and discarding their clinical efficacy in various psychiatric conditions.
In every clinical management, it is the benefit and risk discretion values the judgment and this valued clinical prudence advocates the wisdom of heuristic attitude in following up the patients on atypical antipsychotics, on an individual basis.
References
- Meyer JM, Nasrallah HA. Medical Illness and Schizophrenia. Washington, DC: American Psychiatric Publishing Inc. 2003.
- Casey DE. Metabolic issues and cardiovascular disease in patients with psychiatric disorders. Am J Med. 2005; 118: 15S-22.
- Ahlberg AC, Ljung T, Rosmond R, McEwen B, Holm G. Depression and anxiety symptoms in relation to anthropometry and metabolism in men. Psychiatry Res. 2002; 112: 101-110.
- Rosmond R. Role of stress in the pathogenesis of the metabolic syndrome. Psychoneuroendocrinology. 2005; 30: 1-10.
- Wirshing DA, Boyd JA, Meng LR, Ballon JS, Marder SR. The effects of novel antipsychotics on glucose and lipid levels. J Clin Psychiatry. 2002; 63: 856- 865.
- Atmaca M, Kuloglu M, Tezcan E, Ustundag B. Serum leptin and triglyceride levels in patients on treatment with atypical antipsychotics. J Clin Psychiatry. 2003; 64: 598-604.
- Newcomer JW. Second-generation (atypical) antipsychotics and metabolic effects: a comprehensive literature review. CNS Drugs. 2005; 19: 1-93.
- Fava M, Judge R, Hoog SL, Nilsson ME, Koke SC. Fluoxetine versus sertraline and paroxetine in major depressive disorder: changes in weight with long-term treatment. J Clin Psychiatry. 2000; 61: 863-867.
- Gidal BE, Gail D Anderson, Spencer NW, Maly MM, Murty J, et al. Valproate associated weight gain: potential relation to energy expenditure and metabolism in patients with epilepsy. J Epilepsy. 1996; 9: 234-241.
- Chengappa KN, Chalasani L, Brar JS, Parepally H, Houck P. Changes in body weight and body mass index among psychiatric patients receiving lithium, valproate, or topiramate: an open-label, nonrandomized chart review. Clin Ther. 2002; 24: 1576-1584.
- American Diabetes association, American Psychiatric Association, American Association of Clinical endocrinologists, North American Association for the study of Obesity. Consensus development conference on antipsychotic drugs and obesity and diabetes. J Clin Psychiatry . 2004 ; 65 : 267-272.
- Austin MA. Triglyceride, small, dense low-density lipoprotein, and the atherogenic lipoprotein phenotype. Curr Atheroscler Rep. 2000; 2: 200-207.
- Austin MA. Plasma triglyceride as a risk factor for cardiovascular disease. Can J Cardiol. 1998; 14: 14-17.
- Festa A, D'Agostino R Jr, Mykkänen L, Tracy RP, Hales CN. LDL particle size in relation to insulin, proinsulin, and insulin sensitivity. The Insulin Resistance Atherosclerosis Study. Diabetes Care. 1999; 22: 1688-1693.
- Wei M , Gaskil SP , Haffner SM, Stern MP. Waist circumference as the best predictor of non insulin dependent diabetes mellitus(NIDDM) compared to body mass index, waist / hip ratio and other anthropometric measurements in Mexican American - a 7 year prospective study. Obes Res. 1997; 5 : 16-23.
- Meyer JM. Effects of atypical antipsychotics on weight and serum lipid levels. J Clin Psychiatry. 2001; 62: 27-34.
- Sheitman BB, Bird PM, Binz W, Akinli L, Sanchez C. Olanzapine-induced elevation of plasma triglyceride levels. Am J Psychiatry. 1999; 156: 1471- 1472.
- Osser DN, Najarian DM, Dufresne RL. Olanzapine increases weight and serum triglyceride levels. J Clin Psychiatry. 1999; 60: 767-770.
