
Research Article
Austin J Radiol. 2015;2(5): 1031.
Image Cytometry: Versatile Tool for Probing Cellular Uptake Kinetics of Biodegradable Nanoparticles
Roohi Gupta¹,²*, Mishra P¹ and Mittal A²
¹Department of Biochemical Engineering & Biotechnology, Indian Institute of Technology, India
²Kusuma School of Biological Sciences, Indian Institute of Technology, India
³Department of Radiation Oncology, Fox Chase Cancer Center, USA
*Corresponding author: Roohi Gupta, Department of Radiation Oncology, Fox Chase Cancer Center, P0103, 333 Cottman Avenue, Philadelphia, PA 19111, USA
Received: February 09, 2015; Accepted: August 18, 2015; Published: August 20, 2015
Abstract
Biodegradable nanoparticles have been extensively investigated to facilitate intracellular delivery of therapeutics. Uptake kinetic studies and subsequent quantitative analysis are important in order to develop efficient drug delivery vehicle. In the present work, image cytometry is used for studying intra cellular uptake kinetics of biodegradable nanoparticles with two model systems- HeLa and Caco-2 cells. Nanoparticles (NPs) were formulated using biodegradable Poly D, L-lactic-co-Glycolic Acid (PLGA) polymer containing 6-coumarin as a fluorescent marker and characterized for size, surface morphology, surface charge, loading efficiency and encapsulation efficiency. Cells were incubated with coumarin loaded NPs for defined time intervals (0 to 2 hours) and at different temperature conditions (4°C, 25°C and 37°C). Intracellular amount of nanoparticles (in terms of its fluorescence intensity) was quantified by analyzing the captured fluorescent images of cells in MATLAB (using selfwritten algorithms). Both types of cells took up PLGA NPs quite readily with similar uptake profile and saturation was observed after one hour incubation period. The internalization of NPs was found to be more in Caco-2 cells when compared with HeLa, but the initial rate of uptake was found to be higher in HeLa cells. Also, no statistical difference in uptake kinetics was observed between synchronized and non-synchronized cells. The internalization of NPs was confirmed by confocal laser scanning microscopy. We report for the first time rigorous image analysis using MATLAB for studying uptake kinetics of NPs thus providing a new quantitative tool in studying drug delivery. Also, the results described herein will enhance our basic understanding of the cellular uptake of biodegradable NPs with cells in vitro which in turn could help in developing efficient nanocarrier systems for intracellular delivery of therapeutics.
Keywords: Image cytometry; Nanoparticles; Cell synchronization; Drugdelivery
Introduction
Drug delivery vehicles (e.g. Liposomes, Polymeric nanoparticles, Dendrimers) are promising carriers for delivering therapeutic molecules (e.g. drugs, proteins) to physiological systems [1-6]. Polymeric biodegradable nanoparticles are of particular interest due to their biocompatibility, biodegradability and ability to maintain therapeutic drug levels for sustained periods of time [7-11]. PLGA has been the most extensively investigated polymer used in the formulation of biodegradable NPs [8-10]. PLGA has US Food and Drug Administration approval and due to polyester in nature, it undergoes hydrolysis after entering into the body, forming biologically compatible and metabolizable moieties (lactic acid and glycolic acid) that are eventually removed from the body by the citric acid cycle [10,12].
Pharmaceutical applications of NPs depend upon delivery of these nanoparticles (encapsulating therapeutic molecules) to target cells followed by proper intracellular uptake. Uptake kinetic studies and subsequent quantitative analysis are crucial in order to develop efficient drug delivery vehicle [13]. Previous studies indicated that much emphasis is laid on studying nanosystems of different compositions and its methods of formulations, but little information is available on understanding their interactions with the biological environment (target cells) and their intracellular uptake. Present work attempts to provide insight in to these relatively unexplored areas by studying the uptake kinetics of biodegradable PLGA NPs. The mammalian cancer cell lines, HeLa (the best characterized cell line in terms of its cell biology) and CaCo-2 (widely used and established in vitro cell line to evaluate the intestinal permeability and metabolism of drugs) were used as model systems for present investigations [14,15]. NPs were loaded with a hydrophobic fluorescent probe (model hydrophobic drug) as fluorescence labeling makes cellular uptake of nanoparticles readily detectable by fluorescence microscopy. 6-coumarin was used as a fluorescent marker because the marker shows high fluorescence activity even at low concentration and it does not leach away from nanoparticles in acidic pH present in endolysosomes ensuring accurate intracellular nanoparticles distribution pattern [16]. 6-coumarin loaded PLGA NPs were incubated with cells for defined time intervals and at different temperature conditions. Incubated cells were observed using fluorescence microscopy and images were captured. Quantification of uptake of fluorophore loaded nanoparticles have been estimated using flow cytometry [6,17] or using HPLC analysis [18,19] of fluorophore extracted from cell lysates in previous reports. Fluorescent intensities of internalized nanoparticles have also been quantified using analysis of captured fluorescent images by various commercially available software’s like Image J software [20]. But we report rigorous image analysis using MATLAB for studying uptake kinetics of NPs in contrast to expensive (flow cytometry) or cumbersome procedure (HPLC analysis) as published earlier. Own scripts were written in MATLAB for performing specific image analysis tasks. Uptake studies were also performed with synchronized cells. Confocal laser scanning microscopy was used to confirm internalization of nanoparticles. These studies will be useful to establish the efficacy of biodegradable nanoparticles for intracellular drug delivery and emphasizing the applicability of image cytometry in pharmaceutical research.
Materials and Methods
Materials
Poly (D, L-lactide- co- glycolide) (PLGA, MW 40,000-75,000, copolymer ratio 50:50), Polyvinyl alcohol (PVA, MW 30,000- 70,000), 6- Coumarin (MW 350.44), Thymidine and Nocodazole were purchased from Sigma Chemical (St. Louis, MO, USA). Dichloromethane (HPLC grade) and Formaldehyde were from Qualigens Fine Chemicals (Mumbai, Maharashtra, India). New Born Calf Serum (NBCS), Foetal Bovine Serum (FBS), Dulbecco’s Phosphate Buffer Solution (DPBS) and Dulbecco’s Modified Eagles Medium (DMEM) were purchased from Gibco BRL (Grand Island, NY, USA). Kanamycin acid sulphate, Trypsin-EDTA solution and Propidium Iodide were purchased from Himedia Laboratories Pvt. Ltd (Mumbai, Maharashtra, India). Tissue culture plates (35 mm diameter) and tissue culture flasks (T-25) used were from Corning Life Sciences (Corning, NY, USA).
Formulation of coumarin loaded nanoparticles
Nanoparticles containing a lipophilic fluorescent dye, 6-coumarin [Ex (λ) 450nm/ Em (λ) 490 nm] were formulated by using single emulsion- solvent evaporation technique as described previously [18,21]. In a typical procedure, 90 mg PLGA was dissolved in 3 ml of dichloromethane. A 2% solution of PVA was prepared in cold distilled water, and centrifuged at 1000 rpm for 5 min and then filtered through a 0.22 μm hydrophilic polysulfonic membrane syringe filter (25 mm Millipore filter unit, Millipore, Bedford, MA, USA) to remove any undisclosed PVA. 50μg of 6-coumarin (stock solution 0.5 mg/ml in dichloromethane) was added to the PLGA solution followed by vortexing. It was then placed on an ice bath for 5 min and emulsified using a micro tip probe sonicator (Soniprep 150, MSE Scientific Instruments, Crawley, UK) for 30s, to obtain a primary emulsion. The primary emulsion was then added in two portions to 12 ml of the PVA solution with intermittent vortexing to obtain oil in water emulsion. The emulsion was placed on an ice bath for 5 min and then sonicated for 2 min. The o/w emulsion was stirred overnight on a magnetic stirring plate (Spinit, New Delhi, India) to allow the evaporation of dichloromethane and formation of the nanoparticles. The suspension of nanoparticles was stirred in a vacuum desiccators placed on the magnetic stirring plate for an additional hour to ensure complete removal of the organic solvent. The suspension was transferred into centrifuge tubes and centrifuged at 27000 rpm (110,000×g) for 20 min at 4 °C in an ultracentrifuge (Beckman L8- 60M Ultracentrifuge, Fullerton, CA, USA). The pellet obtained was resuspended in double distilled water and sonicated for 30s on an ice bath to disperse any aggregates. Again ultracentrifugation of the sonicated suspension was carried out under same conditions as mentioned above. The pellet obtained again was resuspended in double distilled water, sonicated and ultra centrifuged was carried out. These centrifugation steps were meant to remove PVA from the formulation. After the last centrifugation, the coumarin loaded PLGA nanoparticles were resuspended in 7 ml of double distilled water and sonicated for 30s on an ice bath. The nanoparticles were then centrifuged at 1000 rpm for 10 min at 4 °C to remove any large aggregates. The supernatant was collected and frozen at -70 °C for 45 min and subsequently lyophilized for 2 days (Labconco Freeze Dry system/ Free zone 4.5, Kansas City, MO, USA). The lyophilized (powdered form) coumarin loaded PLGA nanoparticles were then stored at 4 °C.
Nanoparticle characterization
Size of the nanoparticles was determined by Photon Correlation Spectroscopy (PCS) using quasi elastic light scattering equipment (Brookhaven Instruments Corp., Holtsville, NY, USA) and 90 Plus Particle Sizing Software (Version 3.42). To measure particle size, a dilute suspension (200μg/ml) of nanoparticles was prepared in double distilled water and sonicated on an ice bath for 30s to break the aggregates [18]. The sample was filled in a cuvette and subjected to particle size analysis. Similarly, Zeta potential of the nanoparticles was measured using Malvern Zetasizer Nano ZS (Worcestershire, United Kingdom). The surface morphology of the formulated nanoparticles was visualized by Scanning Electron Microscope (Zeiss EVO 50). Fluorescence techniques were used to evaluate the actual amount of 6-coumarin dye encapsulated in the particles. Because 6-coumarin has inherent fluorescent properties (excitation/ emission= 450 nm/490nm), spectroscopy (PerkinElmer Life And Analytical Sciences, Inc., Waltham, MA, USA) was used to generate a calibration curve of fluorescence values at known concentrations of the dye that allowed quantification of the percent loading of the dye in the NPs. To determine the amount of coumarin encapsulated in the particles, a known quantity of 6-coumarin NPs was dissolved in 1 ml of dichloromethane and kept overnight. The sample was centrifuged at 10,000 rpm for 5 min followed by collection and spectroscopic analysis of the supernatant [6]. The encapsulation efficiency was calculated by indirect method using the following formula [18]. Encapsulation efficiency (%) = [Total dye added (μg) – free dye (μg) / Total dye added (μg)] x 100. The supernatant and the washings (obtained during formulation of NPs) were stored to determine the amount of coumarin that was not entrapped in the NPs (free dye).
Cell culture
Human cervical adenocarcinoma (HeLa cells) and Human epithelial colorectal adenocarcinoma (Caco-2 cells) were used for studying the cellular uptake of coumarin loaded nanoparticles. Both cells were procured from National Centre for Cell Sciences (NCCS), Pune, and Maharashtra, India. HeLa cells were cultured regularly in T-25 tissue culture flasks in DMEM (Dulbecco’s Modified Eagle’s Medium) supplemented with 10% New Born Calf Serum at 37°C and 5% CO2 in a CO2 incubator (Shellab CO2 water jacketed incubator, Cornelius, OR, USA). Caco-2 cells were also cultured regularly in DMEM supplemented with 20% Foetal Bovine Serum at 37°C in 5% CO2. The cells were passaged in a split ratio of 1:2 or 1:3. All the experiments were performed with cells between passages 12 to 14.
Cellular nanoparticle uptake studies: Both HeLa and Caco- 2 cells (in separate sets of experiments) were seeded in 35 mm diameter tissue culture petridishes and were allowed to grow till 80% confluency. A suspension of nanoparticles (2 mg/ml) in DMEM was prepared as stock [19]. The medium in the petri dishes was replaced with the suspension of the nanoparticles (100μg/ml) and incubated for different time intervals 0 min, 15 min, 30 min, 60 min, 90 min and 120 min. After specific time durations the cells were washed three times with DPBS (with Ca/Mg) to remove any non- cell associated nanoparticles [10,19]. Then the cells were fixed with 4% formaldehyde [22] and were observed using an inverted fluorescence microscope IX51 Olympus (Olympus Inc., Tokyo, Japan). Green channel data for Coumarin (Co) visualization was acquired by using the mirror unit U-MWB2 (Olympus Inc., Tokyo, Japan) with excitation filter of 460- 490 nm, emission filter of 520 nm and a dichromatic mirror at 500 nm. The images were acquired using a cooled CCD camera (DP70, Olympus Inc., Tokyo, Japan). The uptake studies were performed at temperatures 4°C, 25°C and 37°C independently for both cell lines. For each case the exposure time for image acquisition (using DP70) was kept same (fixed manually) to allow signal comparisons.
The studies were also conducted with live cells for both cell lines. In live cell imaging, the cells were visualized immediately (after washing step) without fixing and observed using IX51 Olympus and images were captured using Olympus DP70 camera. All the experiments were conducted in triplicates and each result is presented as mean ± SD with n=3.
Cell synchronization: HeLa and Caco-2 cells were synchronized using thymidine and nocodazole [23]. To synchronize cells at the G1 / S boundary, cells were treated at 50% confluence with 2 mM thymidine. After 16 h, cells were washed and fed with fresh medium for 6 h before addition of nocodazole (600 ng/ml from a stock of 5 mg/ml prepared in DMSO) for 1h. The cells were then fixed [22], stained with propidium iodide (0.03mg/ml prepared in DPBS) [nucleic acid binding fluorescent dye, Ex (λ) 530nm/Em (λ) 615 nm], observed using IX51 Olympus and images were captured using Olympus DP70 camera. The synchronized cells (for both cell lines) were also incubated with suspension of the nanoparticles (100 μg/ ml) at 37°C for different time intervals 0 min, 15 min, 30 min, 60 min, 90 min and 120 min, fixed, stained with Propidium Iodide (PI), observed using IX51 Olympus and images were captured using Olympus DP70 camera. Red channel data for PI visualization was acquired by using the mirror unit U-MWG2 (Olympus Inc., Tokyo, Japan) with excitation filter of 510-550 nm, emission filter of 590 nm and a dichromatic mirror at 570 nm. All Images were acquired at same manual camera settings to allow image data comparison. The experiments were conducted in triplicates and each result is presented as mean ± SD with n=3.
Quantification of images in MATLAB
All the images observed (of random fields) using IX51 Olympus microscope (using specific filters) and captured using DP70 camera were analyzed in MATLAB (The Math Works, Inc.). Images were acquired at same manual camera settings to allow image data comparison. For quantification of fluorescence intensity associated with cells, own algorithms were written in MATLAB (for performing specific image analysis tasks) and the total pixels associated with cell in X-Y coordinate system were quantified in terms of population assay and single cell assay. In case of population assay, total fluorescence in a given field of view as well as average fluorescence per cell (obtained by analyzing total fluorescence intensity per field divided by total number of cells in the given field) was analyzed. In case of single cell assay, 25 randomly selected cells were analyzed individually per field of view. The fluorescence intensities at different times were normalized (for all sets of data) with that of 0 min incubation time to compensate for variations in excitation intensities and/or camera output.
Confocal laser scanning microscopy (CLSM)
Intracellular localization was confirmed by confocal laser scanning microscopy (Olympus Fluoview FV 1000 equipped with lasers 405, 488, 515, 543 and 633, Olympus Inc., Tokyo, Japan). HeLa and Caco-2 cells incubated with 6-coumarin labeled PLGA NP’s were excited with 488 nm and detected in channel 1 (dichroic mirror 570 nm, filter 530 nm) and acquisitions were saved.
Results and Discussion
Characterization of nanoparticles
Nanoparticles (NPs) were prepared from PLGA polymer containing free carboxylic end groups, loaded with 6-coumarin molecules using single emulsion solvent evaporation method. The nanoparticles size (obtained from quasi-light scattering) ranged from 132 to 246 nm with polydispersity index ranging from 0.02-0.154, suggesting uniformity in the particle size distribution. Previous reports have shown that particle size is an important property that affects the intracellular uptake of nanoparticles. Though different cell types have different property (specific cell size for uptake) but in general particles < 500nm in size can be internalized by the cells by endocytotic processes [15,16]. Therefore, our formulations of nanoparticles were suited for the cellular uptake studies. The zeta potential of NPs ranged from -8.4 mV to –12.37mV, indicating location of few free carboxylic end groups of the PLGA polymer on the surface of nanoparticles. The negative charge on surface of NPs prevented aggregation of NPs. Loading efficiency of coumarin particles was found out to be 60% w/w with encapsulation efficiency 62%.
The SEM image of the coumarin-loaded PLGA nanoparticles revealed their regular spherical shape (Figure 1A). Their surface morphology was smooth, without any visible pinholes or cracks within the conventional SEM resolution.
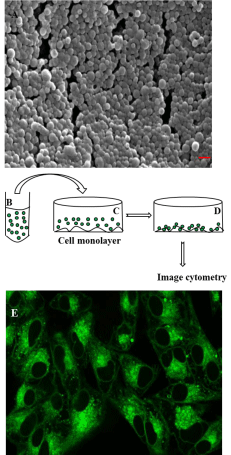
    Figure 1:  Characterization of nanoparticles and experimental design for
its cellular uptake studies: (A) Scanning electron microscopic picture of
6-coumarin loaded PLGA nanoparticles. Spherical particles with smooth
surface of average size ranging from 132 to 246 nm were observed (red
bar- 200 nm). (B) Cartoon represents suspension of fluorescent (6-coumarin)
labeled PLGA nanoparticles (shown by small green circles) incubated with
monolayer of cells as shown in (C). (D)Nanoparticles are internalized by cells
as well as bound to the cell membrane surface. The captured fluorescent
images under various conditions are analyzed in MATLAB (Image cytometry
- see text for details). (E) Confirmation of internalization of nanoparticles
by confocal laser scanning electron microscopy. (E) shows the confocal
image of the midsection of HeLa cells imaged (excited with 488 nm and
detected in channel 1 with dichroic mirror 570 nm and filter 530 nm) with
40x magnification objective after incubating cells with 6-coumarin loaded
nanoparticles for 1 hour.
Cellular uptake of biodegradable nanoparticles
Image cytometry: With modern fluorescence microscopy, high resolution images can be acquired at high rates and quantitative data from images of cells can be extracted using digital image analysis (image cytometry) providing valuable information for various biomedical applications [24,25]. In this work uptake kinetic studies of biodegradable PLGA nanoparticles have been evaluated with HeLa and Caco-2 cells using image cytometry. Cells were incubated with a concentration of 100μg/ml of 6-coumarin loaded PLGA Nanoparticles (NP’s) in the culture medium for different time intervals, washed, fixed and images were captured using DP70 camera (see methods section). The fluorescent dye in NPs served as a sensitive marker to determine quantitatively their cellular uptake and to study their intracellular distribution by fluorescence microscopy. 6-coumarin incorporated in PLGA NP’s does not leach from the NPs during the experimental period [16] thus the fluorescence seen in the cells was due to NPs and not due to free coumarin dye molecules.
The fluorescence intensity associated with cells was quantified by image cytometry (cell image based analysis) using MATLAB (Figures 1B-1D) and were plotted as a function of time for both cell lines in terms of population cell assay and single cell assay ( see methods section for details). Image cytometry (population assay) can be compared to flow cytometry where multiple physical characteristics of single particles (usually cells) can be analyzed like fluorescence intensity. But Image cytometry can more conveniently handle thousands of distinct samples and is also compatible with adherent cell types. Thus image cytometry is more versatile and high in information content. Previous studies have shown that fixing agents may induce artifacts and increased membrane permeability [26] which may lead to discrepancies in observed fluorescence intensities. To rule out such possible variances, the uptake studies for these cells were also performed with live unfixed cells in which cells were observed and images were captured (and quantified later in MATLAB) immediately after completion of incubation time (that is after washing step and without use of any fixing agent) . The data (both qualitative and quantitative) mentioned below are from live cell experiments and were found to be similar with that of fixed cells for both cell lines suggesting no possible artifacts induced by fixing agent in our experiments.
In order to investigate if the cellular uptake of the nanoparticles was mediated by Endocytosis, cells (both HeLa and Caco-2) were incubated with NPs and maintained at 4°C along with incubation at 25°C and 37°C. Endocytosis, an energy dependent process, is blocked at low temperatures [5,26]. HeLa and Caco-2 cells were observed to have similar uptake profile for 6-coumarin loaded PLGA nanoparticles with respect to both population and single cell based assay for all three temperatures (Figure 2). Significant fluorescent signal was observed even after incubating cells for only 15 minutes in both cell lines. This high initial uptake of NP’s might be due to receptor involvement as internalization processes using receptors are usually much faster than constitutional uptake [13]. However, till now there are no earlier reports of any known specific receptor being involved in initial binding/ uptake of PLGA NPs. The fluorescence was observed to increase up to one hour after which plateau was observed. This state of saturation indicates maximum capacity of the amount of particles that can be taken up by these cell lines. This state might be due to depletion of the endocytotic mechanisms and/ or due to saturation of the storage capacity of the cells. On lowering the incubation temperature to 25°C, we observed that the cellular uptake of PLGA NPs was reduced when compared to 37°C and decreased significantly at 4°C (Figure 2) in both cells suggesting that indeed NP uptake is mediated by endocytosis. Qualitative assessment also showed increase in intensity of green fluorescence in cytoplasm with incubation time for both type of cells with saturation seems to be observed after one hour of incubation (Figures 3 and 4). The fluorescence associated with cells was observed to decrease on lowering the temperature from 37°C to 4°C when intensities from corresponding time intervals were compared. The NPs were mostly seems to be diffused throughout the cytoplasm with relatively high fluorescent signal observed surrounding the nucleus for both cells. From both the visual and quantitative analysis (analysis of images in MATLAB), it was demonstrated that NPs were taken up by HeLa and Caco-2 cells via endocytosis. This finding is consistent with previous work that showed endocytosis to be the pathway for intracellular uptake of PLGA NPs for various cells [16,18] however direct comparison of actual data to previous studies is not possible, as differences between NP formulation, dose, cell culture condition and method of quantitative analysis exist. The minimal level of uptake that was observed at 4°C has also been observed earlier by other groups and is thought to be most likely due to passive process such as diffusion and/or due to binding of NPs on the surface of cells [15,16]. At 37°C, the fluorescent signal observed was due to surface association as well as internalization of nanoparticles. The difference in the fluorescence intensity values between 37°C and 4°C gives the fluorescent signal from the internalized nanoparticles only. The difference was plotted as a function of incubation time for both cells (Figure 5A). On comparison between Caco-2 and HeLa cells, it was demonstrated that as the incubation time increases, more fluorescent signal of internalized nanoparticles was observed for Caco-2 cells. For both cells, saturation reaches after one hour as observed earlier. Considering the fluorescence signal at maximum incubation time (120 min) to be 100% (as saturation was demonstrated earlier at this time point), the increase in fluorescence signal at various incubation time points with respect to the signal at maximum incubation time for respective cells was obtained (Figure 5B). It was demonstrated that rate of uptake of NPs in HeLa cells was found to be more when compared with Caco-2 cells. At 15 minutes of post incubation, uptake of NPs was found to be 1.6 folds higher in HeLa than Caco-2. Also at 30 minutes of post incubation, uptake rate was 1.2 times higher again in HeLa than Caco-2, till saturation reaches after one hour in both cells. This initial fast uptake rate could be due to involvement of receptors in internalization of NPs in HeLa cells.
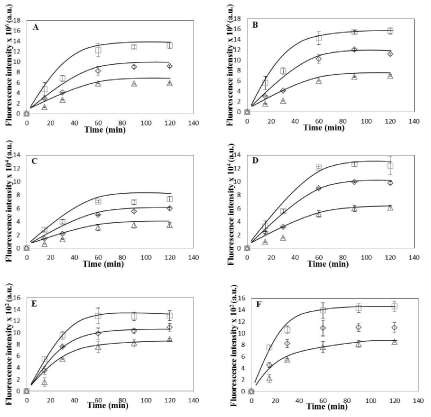
    Figure 2:  Uptake Kinetics of HeLa and Caco-2 cells. (A) Average coumarin fluorescence intensity associated with HeLa cells per field of view with average no. of
cells 179±25. (B) Average coumarin fluorescence intensity associated with Caco-2 cells per field of view with average no. of cells 185±29 (C) Average coumarin
fluorescence intensity associated per HeLa cell obtained by analyzing total fluorescence intensity per field divided by total number of cells in the given field (average
no. of cells 179±25) (D) Average coumarin fluorescence intensity associated per Caco-2 cell obtained by analyzing total fluorescence intensity per field divided by
total number of cells in the given field (average no. of cells 185±29). Data is shown as mean ± standard deviation for independent triplicate experiments (i.e. n =
3).(E) Average coumarin fluorescence intensity associated with 25 individual HeLa cells. (F) Average fluorescence intensity associated with 25 individual Caco-2
cells. Data in (E) and (F) is shown as mean ± standard deviation for 25 randomly selected cells in a random field of view for the three independent experiments.
Coumarin fluorescence intensity is calculated (in MATLAB) from green channel of the fluorescence microscopy images of HeLa and Caco-2 cells (see text for
details).Plots shown are for three temperatures (square- 37°C, diamond- 25 °C, triangle- 4°C). Smooth curves drawn manually to guide the eye.
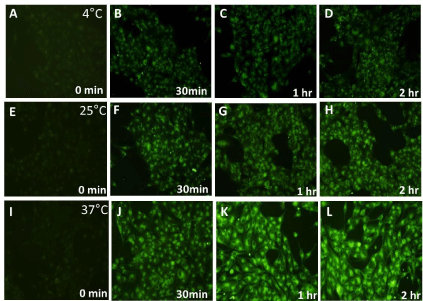
    Figure 3:  Qualitative assessment of fluorescence intensity associated with HeLa cells at 4°C, 25°C and 37°C with respect to time. Fixed HeLa cells observed after
incubating with coumarin loaded PLGA nanoparticles for 0 min , 30 min, 1 hour and 2 hour using a blue filter (excitation wavelength 460-490nm, emission 470nm)
in inverted fluorescence microscope at 20X objective magnification at 4°C as shown in (A), (B), (C) and (D) respectively; at 25°C as shown in (E), (F), (G) and (H)
respectively; and at 37°C as shown in (I), (J), (K) and (L) respectively.
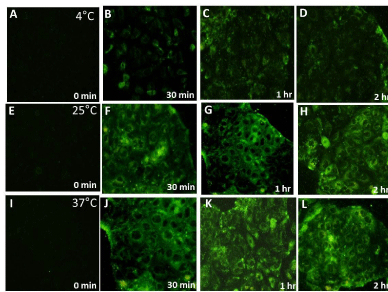
    Figure 4:  Qualitative assessment of fluorescence intensity associated with Caco-2 cells at 4°C, 25°C and 37°C with respect to time. Fixed Caco-2 cells observed
after incubating with coumarin loaded PLGA nanoparticles for 0 min , 30 min, 1 hour and 2 hour using a blue filter (excitation wavelength 460-490nm, emission
470nm) in inverted fluorescence microscope at 20X objective magnification at 4°C as shown in (A), (B), (C) and (D) respectively; at 25°C as shown in (E), (F), (G)
and (H) respectively; and at 37°C as shown in (I), (J), (K) and (L) respectively.
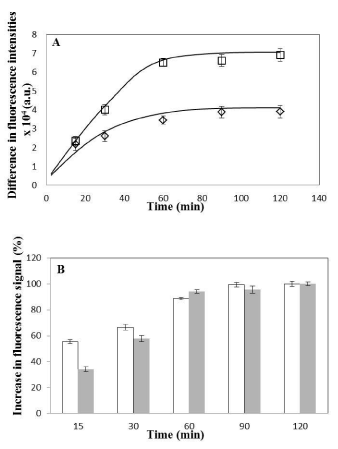
    Figure 5:  Comparison of uptake of nanoparticles in HeLa with Caco-2 cells.
(A) Difference in coumarin fluorescence intensities (between 37°C and 4°C
intensities values, as obtained from single cell population shown in Figure
4E for HeLa and Figure 4F for Caco-2 cells) plotted as a function of time
for Caco-2 (square) and HeLa (diamond) cells. Data is shown as mean ±
standard deviation for independent triplicate experiments (i.e. n = 3). Smooth
curves drawn manually to guide the eye. (B) Increase in fluorescence signal
(plotted as percentage values) at various time intervals obtained with respect
to fluorescence signal at maximum incubation time i.e. 120min (considered
as 100% saturation fluorescence signal) for HeLa (open bars) and Caco-
2 (shaded bars) cells. Calculation is done from the coumarin fluorescence
intensity values obtained from single cell population shown in Figure 4E for
HeLa and Figure 4F for Caco-2 cells. Data is shown as mean ± standard
deviation for independent triplicate experiments (i.e. n = 3).
The fluorescence intensities plotted (by analyzing the images in MATLAB) were the average of the intensity values of randomly selected cells (in case of single cell assay) and all cells in a chosen field of view (in case of population assay). To rule out the possible argument that average could not be taken as cells might be in different stages of the cell cycle (heterogeneous population) hence uptake rates may be different [27], an important control experiment involving cellular uptake studies using synchronized HeLa and Caco-2 cells were performed at 37°C independently. Quantitative estimation of nanoparticle association with these synchronized cells revealed no significant statistical difference when compared to nanoparticle association with non- synchronized cells for both cell lines (Figure 6). These results suggested that our culturing conditions for nonsynchronized cells did not lead to much heterogeneity within the cells hence validating population and single cell assays (performed using MATLAB) for studying uptake kinetics.
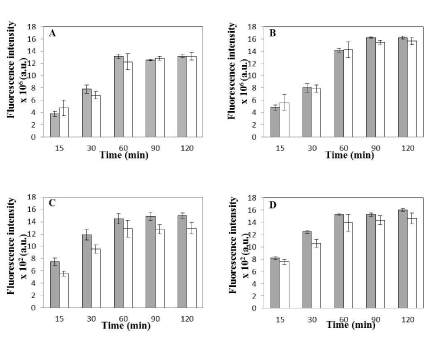
    Figure 6:  Uptake Kinetics of Synchronized vs. Non-Synchronized cells. (A) Average coumarin fluorescence intensity per field of view with respect to time for
synchronized (shaded bars) and non-synchronized (open bars) HeLa cells incubated with coumarin loaded nanoparticles at 37°C (Average no. of cells per field
for synchronized cells-177 ± 26 and Average no. of cells per field for non-synchronized cells-179± 25). (B) Average coumarin fluorescence intensity per field of
view with respect to time for synchronized (shaded bars) and non-synchronized (open bars) Caco-2 cells incubated with coumarin loaded nanoparticles at 37°C
(Average no. of cells per field for synchronized cells-201 ± 19 and Average no. of cells per field for non-synchronized cells-185± 29). Data in (A) and (B) is shown
as mean ± standard deviation for independent triplicate experiments (i.e. n = 3). (C) Average coumarin fluorescence intensity associated with 25 randomly selected
individual cells for synchronized (shaded bars) and non-synchronized (open bars) HeLa cells. (D) Average coumarin fluorescence intensity associated with 25
randomly selected individual cells for synchronized (shaded bars) and non-synchronized (open bars) Caco-2 cells. Data in (C) and (D) is shown as mean ± standard
deviation for 25 randomly selected cells in a random field of view for the three independent experiments. Coumarin fluorescence intensity is calculated (in MATLAB)
from green channel of the fluorescence microscopy images of HeLa and Caco-2 cells (see text for details). No statistical significant difference was observed in any
of the data sets as p>0.01 for all cases (see text for details). Any value smaller than 0.01 indicates statistically significant difference between the two data sets.
Confocal laser- scanning microscopy (CLSM)
Confirmation of intracellular localization was done by confocal laser scanning microscopy. The cross-sectional slices perpendicular to the plane of the cell monolayer midpoint (z-slices) showed that distinct NPs were present in different planes throughout the thickness of the monolayer. Serial z-sections of the cells demonstrated fluorescence activity in all the sections indicating that the nanoparticles were internalized by the cells and not just simply bound to the cell surface. Qualitative assessment (Figure 1E) of confocal images reveals that NPs were mostly seen diffuse (suggesting that particles are spread throughout the cytoplasm) in addition to few punctate structures (suggesting localization of particles in specific intracellular compartments).
Conclusion
Studies relying on analysis of digital images have become popular as large number of acquisitions acquired using advanced microscopes can be easily analyzed for various parameters. Thus image cytometry is much less labor- intensive and high throughput. Fluorescence microscopy along with digital imaging and analysis constructs a basic platform for studying various biomedical applications. Studying drug delivery is one such main area of concern. Biodegradable nanoparticles are the most suited and most investigated system for drug delivery. We present comparison of cellular uptake kinetics in two model systems of fluorescent marker loaded biodegradable NPs using image cytometry. Data collected in our work demonstrates that PLGA nanoparticles were internalized in two different types of epithelial cell lines with similar uptake profile however initial uptake rate was observed to be high in HeLa cells than Caco-2 cells. An observed plateau effect of the cellular uptake efficiency against cell incubation time suggested that the cellular uptake of PLGA NPs is saturable suggesting receptor mediated endocytosis to be the pathway mitigating intracellular localization of PLGA NPs. No previous studies have shown such rigorous quantitative image analysis (in terms of its population and single cell assays) using MATLAB for studying intracellular uptake of PLGA NPs. Also proper controls like synchronization studies, comparison between live and fixed cells image data are not yet reported. The findings of our image analysis studies provides further insights in proving that PLGA nanoparticles have great potential to be an efficient drug delivery vehicle for different types of cells thus making image cytometry a versatile tool for performing quantitative analysis in drug delivery research.
References
- Wu LP, Ficker M, Christensen JB, Trohopoulos PN, Moghimi SM. Dendrimers in Medicine: Therapeutic Concepts and Pharmaceutical Challenges. Bioconjug Chem. 2015; 26: 1198-1211.
- Grottkau BE, Cai X, Wang J, Yang X, Lin Y. Polymeric nanoparticles for a drug delivery system. Curr Drug Metab. 2013; 14: 840-846.
- Menon JU, Ravikumar P, Pise A, Gyawali D, Hsia CC, Nguyen KT. Polymeric nanoparticles for pulmonary protein and DNA delivery. Acta Biomater. 2014; 10: 2643-2652.
- Zhong Y, Meng F, Deng C, Zhong Z. Ligand-directed active tumor-targeting polymeric nanoparticles for cancer chemotherapy. Biomacromolecules. 2014; 15: 1955-1969.
- Richard JP, Melikov K, Brooks H, Prevot P, Lebleu B, Chernomordik LV. Cellular uptake of unconjugated TAT peptide involves clathrin-dependent endocytosis and heparan sulfate receptors. J Biol Chem. 2005; 280: 15300-15306.
- Cartiera MS, Johnson KM, Rajendran V, Caplan MJ, Saltzman WM. The uptake and intracellular fate of PLGA nanoparticles in epithelial cells. Biomaterials. 2009; 30: 2790-2798.
- Keeney M, Deveza L, Yang F. Programming stem cells for therapeutic angiogenesis using biodegradable polymeric nanoparticles. J Vis Exp. 2013; e50736.
- Labhasetwar VD, Dorle AK. Nanoparticles — a colloidal drug delivery system for primaquine and metronidazole. Journal of Controlled Release. 1990; 12: 113-119.
- Jain RA. The manufacturing techniques of various drug loaded biodegradable poly (lactide-co-glycolide) (PLGA) devices. Biomaterials. 2000; 21: 2475-2490.
- Panyam J, Labhasetwar V. Biodegradable nanoparticles for drug and gene delivery to cells and tissue. Adv Drug Deliv Rev. 2003; 55: 329-347.
- Musyanovych A, Schmitz-Wienke J, Mailänder V, Walther P, Landfester K. Preparation of biodegradable polymer nanoparticles by miniemulsion technique and their cell interactions. Macromol Biosci. 2008; 8: 127-139.
- Vasir JK, Labhasetwar V. Biodegradable nanoparticles for cytosolic delivery of therapeutics. Adv Drug Deliv Rev. 2007; 59: 718-728.
- Lorenz MR, Kohnle MV, Dass M, Walther P, Höcherl A, Ziener U, et al. Synthesis of fluorescent polyisoprene nanoparticles and their uptake into various cells. Macromol Biosci. 2008; 8: 711-727.
- Masters JR. HeLa cells 50 years on: the good, the bad and the ugly. Nat Rev Cancer. 2002; 2: 315-319.
- Win KY, Feng SS. Effects of particle size and surface coating on cellular uptake of polymeric nanoparticles for oral delivery of anticancer drugs. Biomaterials. 2005; 26: 2713-2722.
- Panyam J, Sahoo SK, Prabha S, Bargar T, Labhasetwar V. Fluorescence and electron microscopy probes for cellular and tissue uptake of poly(D,L-lactide-co-glycolide) nanoparticles. Int J Pharm. 2003; 262: 1-11.
- Kocbek P, Obermajer N, Cegnar M, Kos J, Kristl J. Targeting cancer cells using PLGA nanoparticles surface modified with monoclonal antibody. Journal of controlled release: official journal of the Controlled Release Society. 2007; 120: 18-26.
- Davda J, Labhasetwar V. Characterization of nanoparticle uptake by endothelial cells. Int J Pharm. 2002; 233: 51-59.
- Sahoo SK, Panyam J, Prabha S, Labhasetwar V. Residual polyvinyl alcohol associated with poly (D, L-lactide-co-glycolide) nanoparticles affects their physical properties and cellular uptake. Journal of controlled release: official journal of the Controlled Release Society. 2002; 82: 105-114.
- Harush-Frenkel O, Debotton N, Benita S, Altschuler Y. Targeting of nanoparticles to the clathrin-mediated endocytic pathway. Biochem Biophys Res Commun. 2007; 353: 26-32.
- Gupta R, Mishra P, Mittal A. Enhancing nucleic acid detection sensitivity of propidium iodide by a three nanometer interaction inside cells and in solutions. J Nanosci Nanotechnol. 2009; 9: 2607-2615.
- Kim SH, Jeong JH, Chun KW, Park TG. Target-specific cellular uptake of PLGA nanoparticles coated with poly(L-lysine)-poly(ethylene glycol)-folate conjugate. Langmuir. 2005; 21: 8852-8857.
- Qin X, Sarnow P. Preferential translation of internal ribosome entry site-containing mRNAs during the mitotic cycle in mammalian cells. J Biol Chem. 2004; 279: 13721-13728.
- Medyukhina A, Timme S, Mokhtari Z, Figge MT. Image-based systems biology of infection. Cytometry A. 2015; 87: 462-470.
- Carpenter AE, Jones TR, Lamprecht MR, Clarke C, Kang IH, Friman O, et al. Cell Profiler: image analysis software for identifying and quantifying cell phenotypes. Genome Biol. 2006; 7: R100.
- Richard JP, Melikov K, Vives E, Ramos C, Verbeure B, Gait MJ, et al. Cell-penetrating peptides. A reevaluation of the mechanism of cellular uptake. J Biol Chem. 2003; 278: 585-590.
- Feldherr CM, Akin D. The permeability of the nuclear envelope in dividing and nondividing cell cultures. J Cell Biol. 1990; 111: 1-8.